SOM Classification and Relationship Between Agents and Map Characteristics
Bipin Khanal, Nobuhiro Ito, Takashi Syamoto, Kazunori Iwata
Department of Information Science, Aichi Institute of Technology; Department of Electrical and Computer Engineering, Nagoya Institute of Technology; Department of Business Administration, Aichi University; Aichi Ken, Japan
http://www.somj.com/ · http://www.openstreetmap.org/ · http://www.robocuprescue.org/index.html
Abstract Natural disasters are becoming very common these days. Disaster simulation is an approach for studying ways to rescue victims of disaster and reduce disaster damage. The RoboCup Rescue simulation package is one of the most popular simulation packages for this purpose. In this package, participating agents such as the fire brigade, ambulance team, and police force work together to achieve the common goal of rescuing victims of disaster in a given environment called a map. Maps in which the evaluation of the agents' ability cannot be properly made and in which the characteristics are different from others are considered as less valued, and otherwise considered as valued maps; in this paper, we focus on classifying maps to distinguish between valued and less-valued maps. We use the clustering technique of self-organizing maps (SOMs) as our method of classification. By using this technique we were able to precisely clarify the relationship between agents and map characteristics, which in turn led to effective and accurate analysis of predictable and best-suited maps for agent actions
Keywords: SOM, Map Characteristics, Relationship between Agents and Maps
1 Introduction
Natural disasters occur frequently and cause immense loss of life and destruction of property. Rescuing victims by human efforts alone has become impossible, because of the increasing rate of victims and disasters. Disaster management is a serious social issue, which involves a large number of heterogeneous agents in a hostile environment. The RoboCup Rescue (RCR) simulation package is one of the most popular simulation packages in which a number of heterogeneous agents work together as a team to achieve a common goal. For disaster researchers, RCR works as a standard basis for developing practical comprehensive simulators. More specifically, the RCR simulation package is a disaster simulation system in which three types of disaster relief teams—the fire brigade, ambulance team, and police force—act to reduce the disaster damage resulted from an earthquake as described in the map of the environment.
Based on simulations, researchers may find that agent A1 works better than agent A2 in environment E1, and agent A2 works better than agent A1 in environment E2. Such scenarios are common in RCR simulations. Thus, it is necessary to analyze the dependency relationship between the map and the RCR agents. The evaluation of an agents' ability relates to a given environment. To properly evaluate an agent's ability, the relationship between the agent and its environment should be clarified. The result of an agent's action in the RCR simulation depends on the map of the given environment, which may change dynamically, making it difficult to evaluate the agents' ability. A characteristic study of the map may reveal exceptional results in some parts of the environment, even in the limited context of road networks and buildings. Hence, this paper focuses on the classification of the map using self-organizing maps (SOMs); our aim is to design and operationalize agents that decide strategy based on map characteristics.
2 Analyzing the Relationship between Agents and Maps
The surrounding things (except the agent) in a multi-agent system (MAS) refer to the agent's environment. Described via a map, the environment is a first-class abstraction that provides the surrounding conditions in which agents exist; furthermore, the environment mediates both the interaction between agents and their access to resources. The environment is an explicit part of a MAS because of the following reasons:
- It provides the surrounding conditions in which agents exist,
- It becomes a building block for designing MAS applications.
The environment of a MAS is of fundamental importance in the analysis, design, and operation of the system. An agent is anything that can sense and perform actions upon or within its environment. In a MAS, the environment is an active entity with its own processes that can change its own state, independent of the activity of the embedded agents.
In this section, we analyze a map as the RCR agent environment. In general, map data includes features such as roads, railroads, rivers, buildings, geographical features, and so on; however, in the RCR simulation, the map includes only roads and buildings. We focus on building information and road networks to analyze the dependency relationship between the map and the RCR scores.
There are five components that make up the map data: (1) the building area; (2) the building property; (3) the position relationship of the building; (4) the position relationship between buildings and roads; and (5) the density that affects disaster relief work. In this paper, we quantify building information and road networks for each of the components, and define them as indices of buildings and roads in the subsection below.
2.1 Building and road indices
In this section, we define indices of buildings and roads. Overall, semi-gross building coverage relates to building area. Contour length relates to building property. The degree of dependence, distance to adjacent buildings, and dispersal of buildings are features that relate to the positioning of the building. The length of the adjacent road and interspaces ratio are features related to the position relationship between buildings and roads. The total road length, road density, and building density are features that relate to density.
Semi-gross building coverage: The gross area is a land area identified by the centerlines of surrounding roads; a semi-gross area is derived from the gross area by subtracting the road areas. To calculate the semi-gross building coverage, we first calculate the building coverage for each semi-gross area on the map. Next, we calculate the average building coverage for all semi-gross areas. We define this average as the index of building coverage for each semi-gross area on the map.
Contour length: We calculate the average building circumference and define this average as the contour length index.
Degree of dependence: The degree of dependence is the ratio of a building area to the largest building area among adjacent buildings. We calculate the degree of dependence of each building, then average all degrees of dependence. We define this average as the degree of dependence index.
Distance to adjacent buildings: For each building, we calculate the distance to the farthest building among adjacent buildings. Next, we calculate the average of these distances. We define this average as the distance to adjacent buildings index.
Dispersal of buildings: For each building, we calculate the difference between the minimum distance to the nearest building and the maximum distance to the farthest building among adjacent buildings. Next, we calculate the average of these differences. We define this average as the dispersal of buildings index.
Length to adjacent road: For each building, we calculate the distance to the nearest road. Next, we calculate the average of these distance. We define this average as the length to adjacent road index.
Interspaces ratio: We measure the length of building verges to the nearest road and the nearest road length for each building on a map. Next, we calculate the length of building verges to the nearest road, divided by the nearest road length. We call this ratio the interspace ratio of the building. Given this measure for all buildings, we calculate the average and define this average as the interspace ratio index.
Total road length: We calculate the sum of all road lengths and define this as the total road length index.
Road density: Road density is the ratio of road area to overall map area. We define this ratio as the road density index.
Building density: Building density is the ratio of the number of buildings to the map area. We define this ratio as the building density index.
3 Map Characteristics and Agent Evaluation
The result of each agent's actions in the RCR simulation depends on the map of the given environment, which can change dynamically, making it difficult to evaluate the agents' ability. In performing a characteristic study of the map, even in the limited context of only road networks and buildings, we might find exceptional results in some parts of the map. There are numerous experiments already performed regarding the relationship between agent evaluation and map characteristics. Almost all of these experiments show that there are still some maps in which it is very difficult to predict agent evaluation.
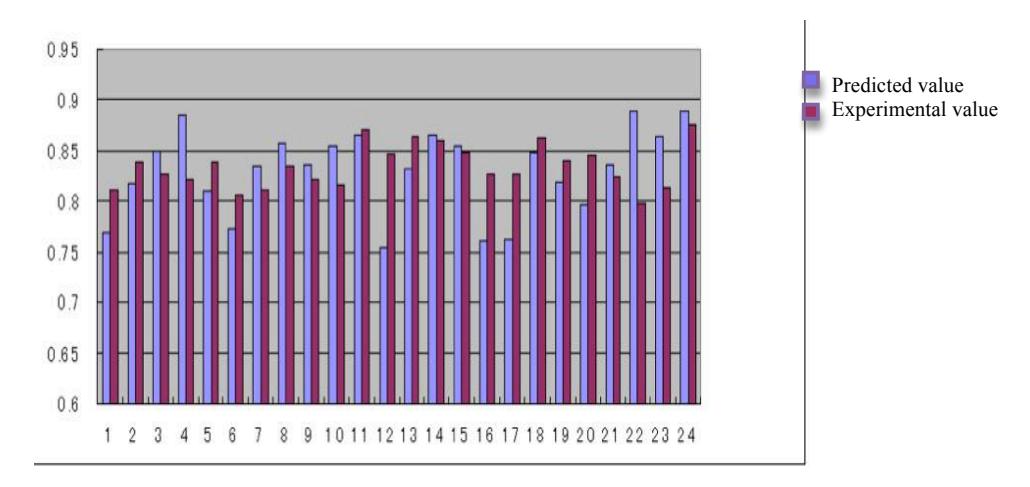
Fig. 1 shows the results of our earlier research. In the figure, the horizontal axis shows the identifying map number and the vertical axis shows the agent evaluation values. We observe that maps 11 and 18 have small differences in their predicted and actual experimental values. Maps 4 and 22 show the experimental value to be less than the predicted value, whereas maps 12, 16, and 17 show the experimental value to be much larger than the predicted value. Clearly, there are still maps in which the evaluation of agent is beyond prediction. To solve the above problem, we propose the classification of maps. For this, we perform map clustering that helps in collecting maps with similar characteristics, thereby making agent evaluation easier and more accurate.
4 Clustering
We propose clustering as an approach to classify maps as being either easy or difficult to evaluate. Clustering has the following merits:
- Maps with similar characteristics and tendencies can be gathered.
- Exceptional maps that have different characteristics can be distinguished.
4.1 Self-organizing maps (SOMs)
Among the many techniques for clustering, SOM is a competitive learning type of neural network described by Kohonen as a method to represent multidimensional data in a two-dimensional plane. A characteristic of SOMs is that the two-dimensional output space (a map) can represent high-dimensional data and maintain its topological relation. SOMs are different from other artificial neural networks in the sense that they use a neighborhood function to preserve the topological properties of the input space. In SOM, as suggested by Kohonen, there are different output space forms, including Basic SOM (rectangular shape of the two-dimensional plane), Tours SOM (removing all edges by joining the right-left and top-bottom edges of the output space together), and Spherical SOM (globular output space).
We use Spherical SOM for clustering the maps of RCR simulations. Using this technique, we can distinguish the maps with odd characteristics, which make it difficult to determine agent evaluation.
4.1.1 Spherical SOM
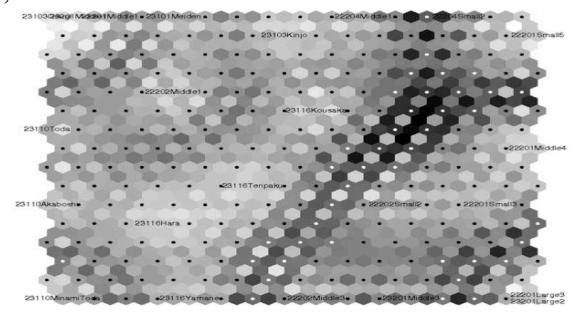
In Spherical SOM, the output space is spherical, unlike Basic SOM in which the output space is two-dimensional. Fig. 2 shows the result of Basic SOM given as input maps of 24 Japanese cities. In the figure, black and white dots represent nodes; the smaller the Euclidean distance between nodes, the closer the surrounding hexagonal color is to white, and vice versa.
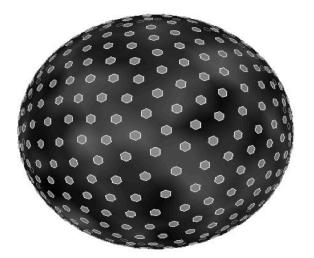
Fig. 3 shows a Spherical SOM in which white hexagons represent nodes. The primary difference between Basic and Spherical SOMs is the absence of edges in Spherical SOM.
Furthermore, because the size of the learning domain is limited in Basic SOM, there is a possibility of information loss during the learning process. Moreover, the use of random numbers at initialization may cause poor results in Basic SOM.
These problems can be solved by using Spherical SOM in which multidimensional data can be read without any information loss. Owing to its ability to overcome the problems of Basic SOM, we use Spherical SOM in our study.
4.2 Derivation of the SOM algorithm
Since the SOM belongs to the category of vector quantization (VQ), the starting point must be some kind of quantization error in the vector space. We assume that $x \in \Re^n$ is the input vector and $m_i \in \Re^n$ and $i \in {\text{indices of buildings and roads}}$ are the reference vectors. Let $d(x,m_i)$ define a generalized distance function of x and $m_i$ . The quantization error is defined as
$d(x,m_c) = \min_i {d(x,m_i)}$ , where c is the index of the closest reference vector to x in the space of input signals. The neighborhood function $h_{ci} = h_{ci}(t)$ describes the interaction of reference vectors $m_i$ and $m_c$ during adaptation, and is often a function of time t. If L denotes the set of indices of all lattice units, the distortion measure e is defined as
$e = \sum_{i \in L} h_{ci} d(x, m_i)$ , the sum of distance functions weighted by $h_{ci}$ , whereby c is
the index of the closest codebook vector to x.
Considering the stochastic samples of the distortion measure, if ${x(t), t=1,2...}$ is a sequence of input samples and ${m_i(t), t=1,2....}$ a recursive sequence of codebook vectors $m_i$ , then $e(t) = \sum_{i \in L} h_{ci}(t) d[x(t), m_i(t)]$
is a stochastic variable and the sequence is defined by
$m_i(t+1) = m_i(t) - \lambda \cdot \nabla m_i(t) e(t)$ is used to find an approximation to the
optimum as asymptotic values of mi . This is the SOM algorithm for the generalized distance function d(x,mi).
5 Results
We researched the relationship between rescue agents and maps in which the results are found to be dynamic, since the agents are map-dependent. We determined that there is a relationship between agents and maps; furthermore, we were able to predict the results from agent actions.
From these results, we were able to create agents for different maps, which can change their strategies in correspondence to each map. For example, map A requires agent algorithm X, map B requires algorithm Y, and so on.
Due to the presence of some exceptional maps that had different characteristics, the accuracy of prediction was low. We therefore experimented by using SOM to classify the maps such that the relationship between map characteristics and agents could be predicted and analyzed accurately. We used only those Japanese maps that were used in our latest research, but this time we use OpenStreetMap. OpenStreetMap is a free editable map of the whole world. OpenStreetMap allows us to view, edit and use geographical data in a collaborative way from anywhere on Earth.
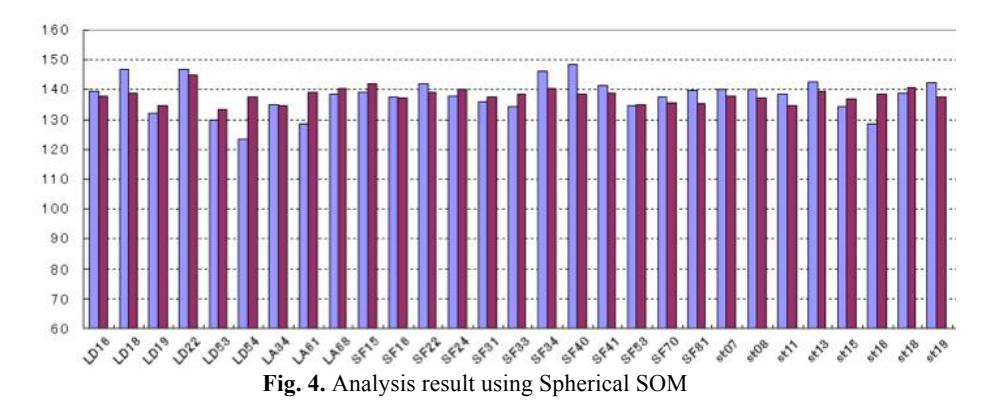
Fig. 4 shows the results of our experiment using Spherical SOM and OpenStreetMap. In the figure, the horizontal axis shows the map of different states, including the following:
LD = London
LA = Los Angeles
SF = San Francisco
st = Santiago.
The vertical axis shows the agents' evaluation values. From this data, we observe that the difference between the predicted and experimental values has decreased. This implies that the accuracy rate has been increased in comparison to our last research.
6 Conclusion
From our research, we conclude that there is a dependency relationship between agents and map characteristics. In a set of maps, there can be some exceptional maps for which the prediction of agent actions is inaccurate. Such maps cause erroneous results of agent movement. Therefore, we applied classification techniques that identify such exceptional maps. We used SOMs as our classification technique. By the use of this clustering technique, we were able to precisely clarify the relationship between agents and map characteristics, which in turn led to effective and accurate analysis of predictable and best-suited maps for agent actions.
References
- David V. Pynadath and Milind Tambe. Multiagent Teamwork: Analyzing the Optimality and Complexity Key Theories and Models. AAMAS, pp. 873–880, 2002. ****, Vol. LNCS2719, pp. 1181–1196, June 2003.
- Toshihito, Suzuki, Nobuhiro, Ito: RoboCupRescue2010–RescueSimulationLeague Team Description Paper<Naito Rescue 2010> (2010).
- Tokudaka, Heizou, Ooyabu, matasige, Horio, Keiichi, Fujimura, Kikurou: Self-Organizing Map:Springer. Japan (2005).
- Nakazuka, Taisuke, Fujimura, Kikurou, Ookita, Masaaki,Ooyabu, Matasige, Tokudata, Heizou: Properties and application of Sphere SOM: Neuro-Computing, 104(139), pp. 67–72 (2004).
- SOM ジャパン http://www.somj.com/
- http://www.openstreetmap.org/
- RoboCupRescue Home. http://www.robocuprescue.org/index.html.