RoboCup Rescue 2010 – Rescue Simulation League Team Description Paper Brave Circles (Iran)
Hamed Shahbazi, Abbas abdolmaleki, Sajjad Salehi, Mahdi Shahsavari, Mostafa Movahedi
Sheikhbahaee University Esfahan-Iran
Abstract Robocup rescue simulation is not only a competition among intelligent agents but also a practical platform to simulate disaster conditions in real world. It is important in an earthquake disaster simulation system to consider all aspects of an earthquake. One of these important aspects is flood that is caused by the earthquake. Till now no simulation of flood and flow of water are implemented in RCRSS. BraveCircles team as a combination of UI-AI and BamResque old members try to introduce some basic ideas about requirements and issues of a flood simulator to be integrated in RCRSS.
Introduction
The RoboCup Rescue project was inspired by Hanshin-Awaji earthquake in 1995 which many of people killed in Kobe city. The main goal of this project is to promote research and development in area of disaster rescue in different aspects. One of these aspects is how we can help to save lives in natural disasters like earthquakes, Tsunami and flood. Since 2000 which this project was started, many of effects of an earthquake are simulated like igniting and collapse of buildings, blocking of roads and etc. But so far no simulation of flood is integrated in RCRSS.
Earthquakes cause floods. When an earthquake occurs, collapse of embankments of rivers, dam, weir and also damage of urban water supply pipeline network, urban drainage system network cause floods if we want to make a more real simulation of earthquake and using the result of simulation in real environments, it is vital to simulate flood and flow of water in an earthquakestricken area. Now the question remains is that what are the effects of the flood?
The damages that occur during heavy floods can be so catastrophic that some people even lose their homes. Moreover, a lot of lives have been lost during floods, which makes it such a serious issue. Usually, during intense floods, water is often waist deep and a lot of cars and infrastructures are submerged. Strong currents can also easily uproot trees, crush glass, breakdown doors and even dislodge a car. At the same time, many foreign objects can be floating around, which can easily hurt or injure people in its path. The catastrophic effect of a flood can only be seen in its aftermath. Your surroundings will look like a battle field wherein lamp posts are bent and scattered around the city, trees are uprooted and lying on the streets and cars smashed and turned upside down.
If the cleanup process is not executed properly, a lot of serious problems may arise. One of the problems that may happen is residual water seeping into the cracks of houses and buildings. If this happens, the structure may become unstable and could even lead to dangerous corrosion. Chemicals may also wash into nearby water reservoirs or dams, posting a major threat to the health of millions of people. All these are highly plausible and should not be undermined at any cost. The government and communities need to work together to be able to remedy the situation quickly. [6]
So to simulate such a situation we have categorized the overall calculations in five parts:
- Calculation of level of water in each area (our computational domain) which depends on water flow rate that enters and exits.
- Calculation of amount of collapse that water causes in each area which depends on speed of water and material of object has been exposed to water.
- Calculation of effects of water on damage and buriedness of civilian agents which depends on speed and height of water that civilian has been exposed to.
- Calculation of effects of water on speed of movement of civilian and platoon agents in disaster environment which depends on flow speed and height of water in area that civilian or platoon agents are in it.
- Calculation of effects of water on temperature of each area.
Calculations of parts 1,2,3,4 and 5 are done in flood, collapse, misc, traffic and fire simulators respectively.
In fact all simulators of collapse, misc, traffic and fire utilize the result of calculations of flood simulator (first part) to do mentioned calculations. Therefore the main calculations are done in flood simulator. So In this TDP the flood simulation model and its visualization are discussed in detail.
This TDP is organized as follows. In Section 2 we explain the infrastructures which are needed to simulate the flood. Section 3, discusses how to model the flood simulation, in detail. In Section 4 we show how to visualize the flood in RCRSS. And Section 5 concludes.
2. Infrastructures
We apply some changes to World Model, Map and Scenario to implement flood affect in RCRSS. Although we add new file named pipeline.gml to save Pipeline data.
2.1 World Model
Now, the world model has new entity that called Pipe with, startLocation, endLocation, segments and diameter.We define segments for pipe to indicate exact location of pipe fault and diameter use for calculate how much water outs from pipe in a time step.
Also, waterLevel,elevationand velocityVectorwere added to all areas. Where waterLevel is amount of water of an area and elevation is height above the sea level and velocityVector is velocity vector of water in area.
Buildings have penetration rate than indicate how much water penetrate in each time step according to building material and its damage.
2.2 pipeline.gml
As mentioned above we use pipeline.gml to save pipeline data. The structure of this file is as follow:
<rcrs:PipeList>
 .
 .
 .
</rcrs:PipeList>
<gml:Pipe gml:id="3048">
    <gml:start>537407,417788</gml:start>
    <gml:end>549017,373262</gml:end>
    <gml:radius>150</gml:radius>
    <gml:segments>4</gml:segments>
</gml:Pipe>
<gml:Pipe gml:id="3049">
    <gml:start>549017,373262</gml:start>
    <gml:end>569121,372150</gml:end>
    <gml:radius>200</gml:radius>
    <gml:segments>5</gml:segments>
</gml:Pipe>
The GIS Server read this file just like "map.gml" and "scenario.xml" and completes the world model, then kernel send world model to FoodSimulator.
2.3 senario.xml
Damaged pipe indicate in scenario as follow (changes are highlighted):
<rcr:scenario>
 <rcr:refuge rcr:id="5850" />
 <rcr:civilian rcr:location="23378" />
 <rcr:policeforce rcr:location="1699" />
 <rcr:firebrigade rcr:location="29202" />
 <rcr:ambulanceteam rcr:location="23378" />
 <rcr:fire rcr:location="21545" />
 <rcr:pipefault rcr:id="3049" rcr:segment="2" />
</rcr:scenario>
2.4 map.gml
We add elevation to areas as follow (changes are highlighted):
<rcrs:Face type="other">
  <rcrs:BuildingProperty></rcrs:BuildingProperty>
  <gml:Face gml:id="1570">
  <gml:directedEdge orientation="+" xlink:href="#1571" />
  <gml:directedEdge orientation="-" xlink:href="#1574" />
  <gml:elevation>2103</gml:elevation>
  <gml:polygon>
    <gml:LinearRing>
       <gml:coordinates>711200,268640 712577,273358
       737985,266720 735925,262113 711200,268640
       </gml:coordinates>
    </gml:LinearRing>
  </gml:polygon>
  </gml:Face>
</rcrs:Face>
3. Flood Simulator
Flood simulator calculates waterLevel and the velocity vector of water for each area.
3.1 mathematic model of flood simulation
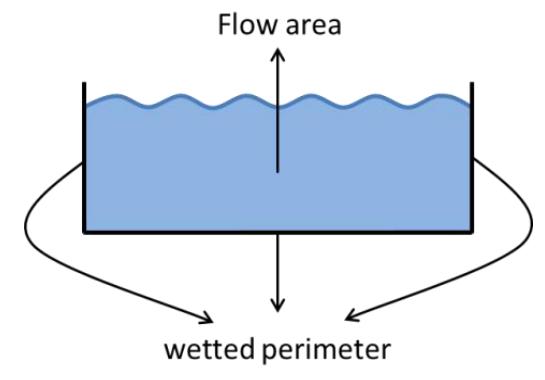
Amount of water in each area depended on flow rate of water in that area. Flow rate of each area calculates by formula1.
$$Q = A. \bar{v}$$
$$R_h = A/p$$
$$\bar{v} = 1/n R_h^{2/3} s_0^{1/2}$$
$$Q = 1/n A R_h^{2/3} S_0^{1/2}$$
Formula1. Flow rate
Parameter description [formula1]
Q: flow rate
A: flow area
p: wetted perimeter
v: flow velocity
Rh: hydraulic radius
S0: gradient
n: roughness coefficient (gets from table1)
Table1. Roughness coefficient [1]
| wetted perimeter | n | wetted perimeter | n |
|---|---|---|---|
| A. Natural channels | D. Artificially lined channels | ||
| Clean and Straight | 0.030 | Glass | 0.010 |
| Sluggish with deep pools | 0.040 | Brass | 0.011 |
| Major rivers | 0.035 | Steel, smooth | 0.012 |
| B. Flood plains | Steel, painted | 0.014 | |
| Pasture , farmland | 0.035 | Steel, riveted | 0.015 |
| Light brush | 0.050 | Cast iron | 0.013 |
| Heavy brush | 0.075 | Concrete, finished | 0.012 |
| Trees | 0.15 | Concrete, unfinished | 0.014 |
| C. Excavated earth channels | Planed wood | 0.012 | |
| Clean | 0.022 | Clay tile | 0.014 |
| Gravelly | 0.025 | Brick work | 0.015 |
| Weedy | 0.030 | Asphalt | 0.016 |
| Stony, cobbles | 0.035 | Corrugated metal | 0.022 |
| Rubble masonry | 0.025 |
3.2 Computational domain
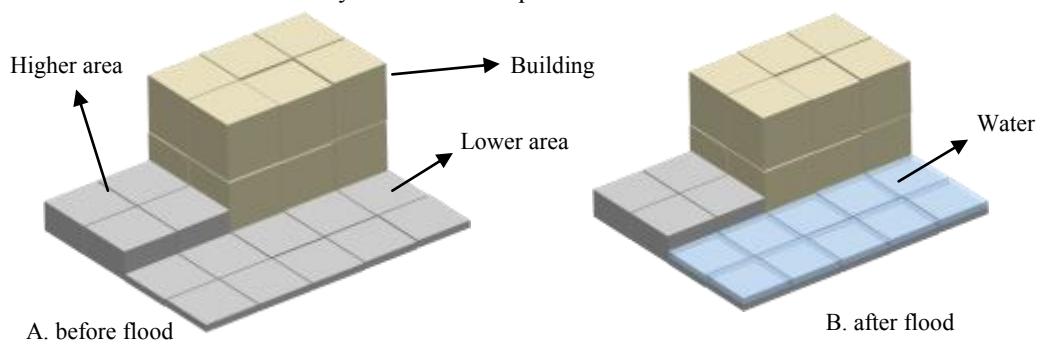
We divided each area to 1m*1m squares to make it easier to work with. Properties of each square are the same as an area [Fig2].
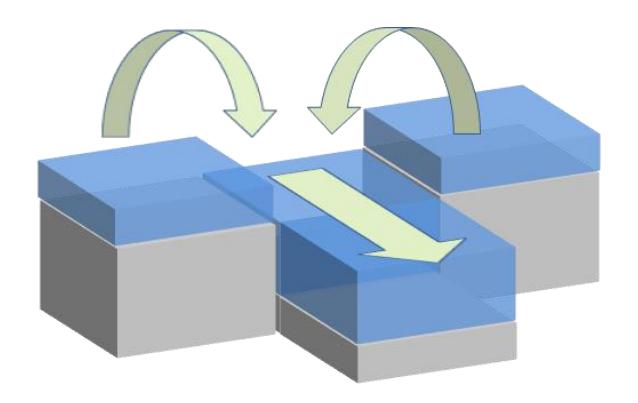
In each cycle the height and velocity of water is calculated in each square by formula1. So water always flows to the squares that have lower elevation.
3.3 Calculation process
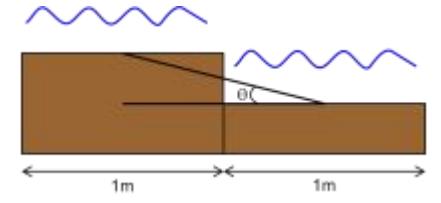
First in cycle 1 simulator calculates the gradient vector between areas which now are 1m*1m squares using difference between elevation of current area and its neighbors (Fig3).
4. Visualization
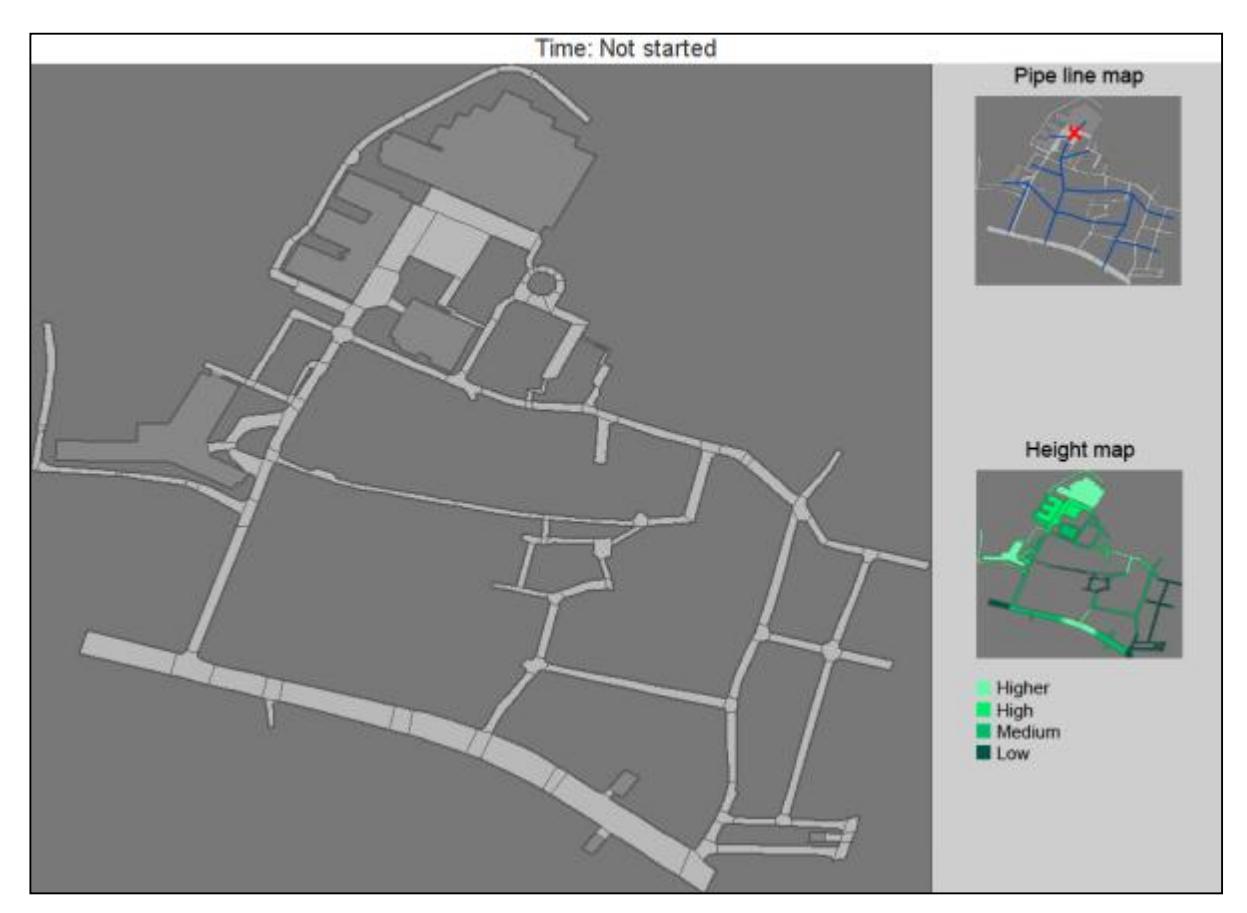
We offer a viewer that has ability to show these features:
- Pipeline Network
- Damaged pipes
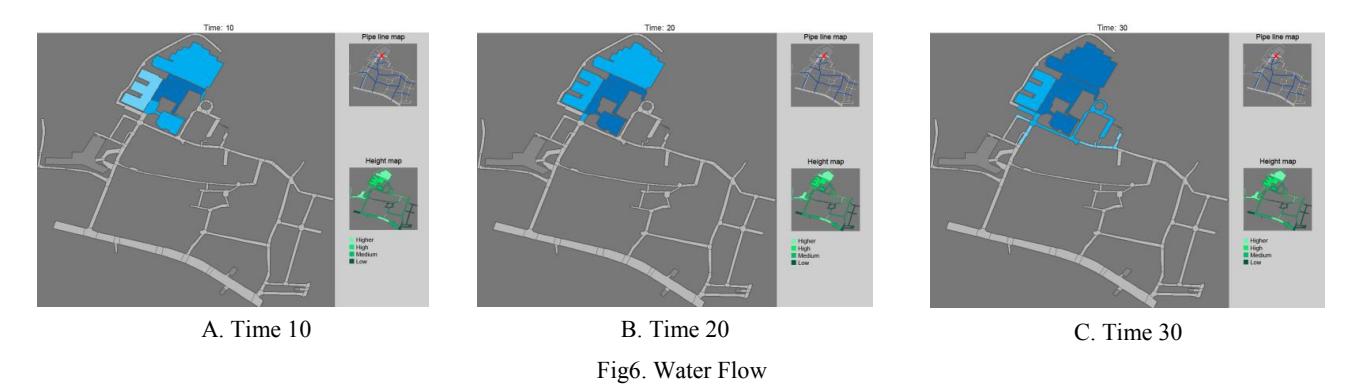
- Amount of water in each area
- Height map
As you see in Fig5 we add two small sizes of map at right to show pipeline network and height map.
According to Pipe entities in world model viewer draws pipeline network and on damaged pipe draws a red cross. In height map viewer fills areas with 4 colors. Darker areas are lower and lighters are higher areas.
5. Conclusion
In this TDP, We discussed about a new flood simulator to be integrated in RCRSS. In introduction we explained why a flood simulator is needed and how it can make the simulation more real and practical. And in next sections we discussed about the requirements and modeling of flood simulation and finally we showed how to visualize the flood in viewer.
References
[1] Fundamentals of Fluid Mechanics by Bruce R. Munson, Donald F. Young, Theodore H. Okiishi, and Wade W. Huebsch 1997 [2] Introduction to Fluid Mechanics by Robert W. Fox, Alan T. McDonald and Philip J. Pritchard, 5th Edition [3] M. Ahmadi, T. Takahashi, J. Habibi, and T.o Koto. Robocuprescue system and arian: A exible infrastructure for multi-agent research and education. In 15th IEEE Conference on Tools with Arti_cial Intelligence, pages 351{355, 2003. [4] M. Tanigawa, T. Takahashi, T. Koto, I. Takeuchi, and I. Noda. Urban ood simulation as a component of integrated earthquake disaster simulation system. In Proc. 2005 IEEE Int. Workshop on Safety, Security and Rescue Robotics, 2005. [5] M. Ohata N. Ito T. Takahashi, S. Tadokoro. Agent based approach in disaster rescue simulation - from test-bed of multiagent system to practical application. In RoboCup 2001:Robot Soccer World Cup V, pages 102{111, 2002. [6] www.therestorationresource.com