YILDIZ Team Description Paper for Virtual Robots Competition 2012
Sırma Yavuz, M. Fatih Amasyalı, Muhammet Balcılar, Erkan Uslu, Zeyneb Kurt, Ozan Özışık, Feruz Davletov
Yıldız Technical University Computer Engineering Department Davutpaşa, İstanbul, 34220, Turkey
Abstract This paper is a short review of technologies developed by YILDIZ team for participating in RoboCup Iran Open 2012 Virtual Robot Competitions. A short description of localization and mapping, image enhancement, navigation and victim detection techniques that are being developed and the initial results of the algorithms are given.
1 Introduction
Probabilistic Robotics Group of Yıldız Technical University, which consists of a team of students and academicians, has been working on autonomous robots since its establishment in 2007. Autonomous robots can perform desired tasks without continuous human guidance which is necessary for Urban Search and Rescue area [1, 2]. Urban Search and Rescue, which is a challenging area of robotics, still in the early years compared to other areas and waiting for many new tactics, techniques and strategies to be unfold.
Development strategy of our team has two stages. At the first stage the modules solving the problems of localization and mapping, navigation and victim detection are being developed and tested independently for a single robot. At the end of the first stage one robot will be able to solve all the problems involved. The second stage of the development requires a multi-robot coordination system to be formed. Upon completion of these stages the system will be tested and improved using several robots. Our team also aims to remove the barriers between virtual and real robots, and utilize the codes on real robots.
2 Our Goals
Last year's world championship was the first experience of our team on Robocup. We have learned a lot of lessons over the competition period. For this year, we concentrate on developing a user interface and communication protocol. This system is planned to be used by both our real robots and virtual robots.
The system is designed to have a hierarchical structure, containing different modules responsible of different jobs. Every fundamental part of the main problem divided into modules which can function independently. Normally, each of our virtual robots intelligent enough to explore the area, find the victims and construct a map. Using multiple robots made the system more accurate and robust.
The team members and their contributions are as follows:
Control and monitor interface : Feruz Davletov, Erkan Uslu
Communication, information sharing : Muhammet Balcılar
SLAM algorithm : Zeyneb Kurt, Sırma Yavuz Waypoint control : Ozan Özışık, M. Fatih Amasyalı
Victim detection : Muhammet Balcılar
Supervising, system design : Sırma Yavuz, M. Fatih Amasyalı
3 System Overview
The main software modules are user interface, localization, mapping, navigation, communication and victim detection. Robots on their own have all those modules equipped and ready-to-use, there is also a multi-robot coordination module covering them all. As the ground robots we use the Pioneer 3AT model. The sensors to be used are determined as Hokuyo URG04L model laser scanner, camera, ultrasonic, encoder, touch and odometry sensors.
4 User Interface
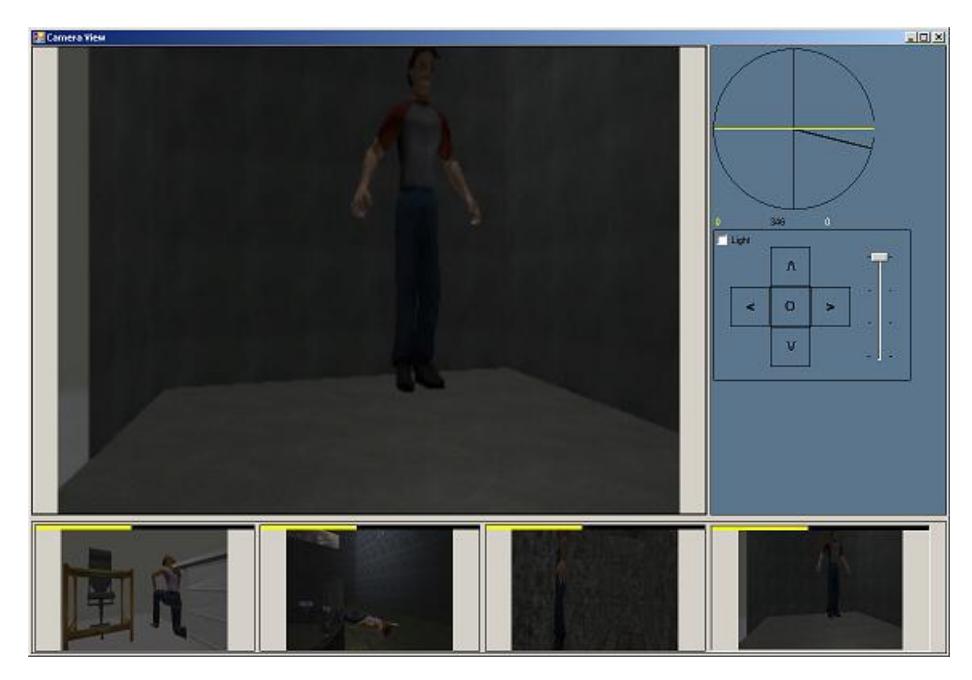
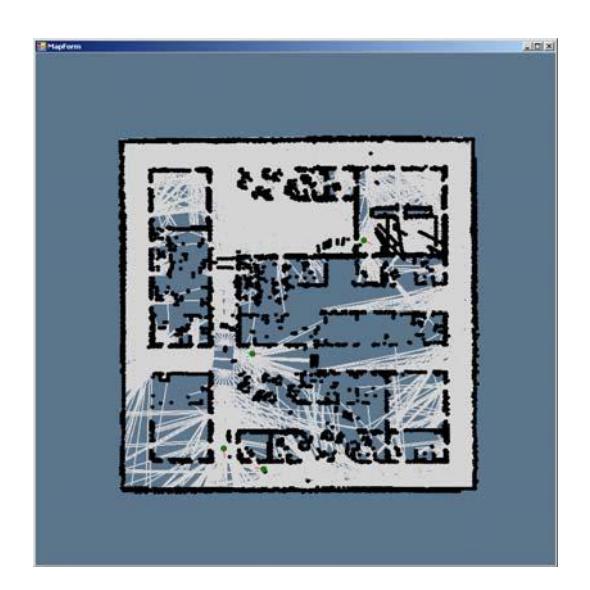
The user interface is developed to control 16 robots at the same time and consists of two forms as shown in Fig. 1 and Fig.2.
At the Form 1 of the user interface (Fig. 1), the thumbnail of all robots' camera views, the camera view and the orientation of the selected robot can be seen.
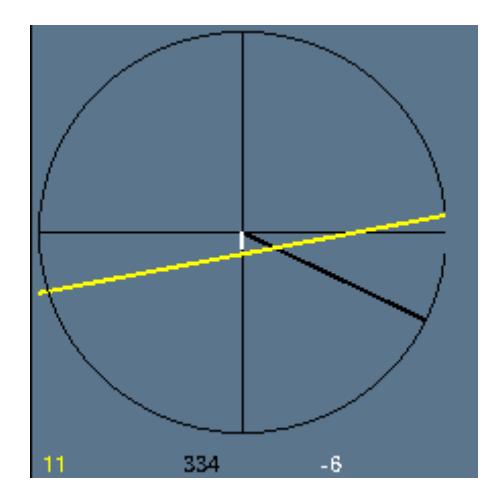
At the Form 2 of the user interface (Fig. 2), the map of the disaster area, the coordinates and directions of the robots, the scanned areas and obstacles can be seen. The robot to be controlled is selected from the map. The robots can be controlled by the user keyboard or the direction arrows on the Form 1. The speed of the robots can be adjusted by the controller next to the direction arrows. The orientation graph is given in Fig. 3.
In Fig. 3, yellow line is ROLL, white line is PITCH, and black line is YAW, according to the starting point.
5 Simultaneous Localization and Mapping
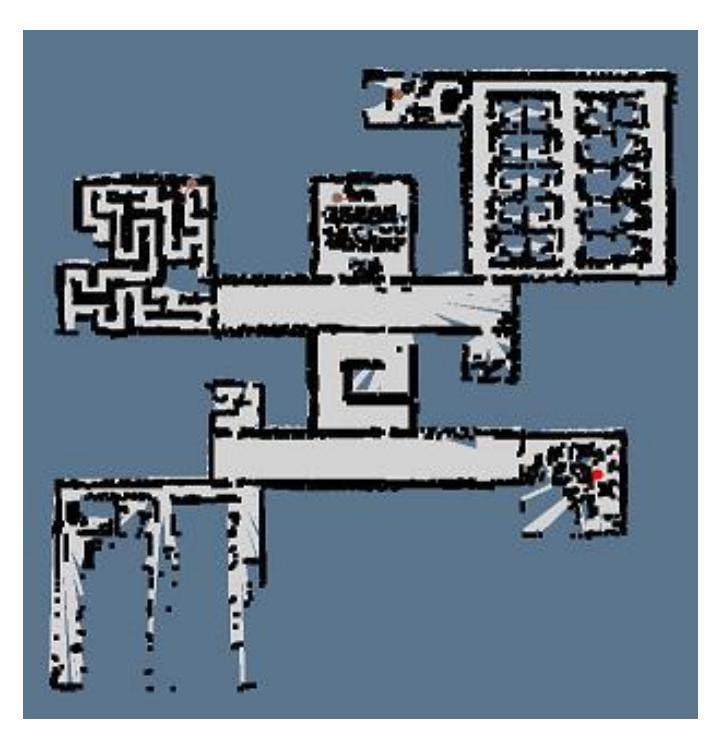
To generate a map of the environment and to determine the positions of the victims SLAM algorithms are used. We are able to produce reliable sensor-based maps using FastSlam and EKF Slam Algorithms [3, 4, 5]. For the mapping EKF based FastSLAM [6] algorithm is preferred. The map and pose of the robot are estimated using the range measurements obtained by robot and the control signals that make robot move. In Fig. 1, a sample map generated in USARSIM environment is given.
6 Image Enhancement
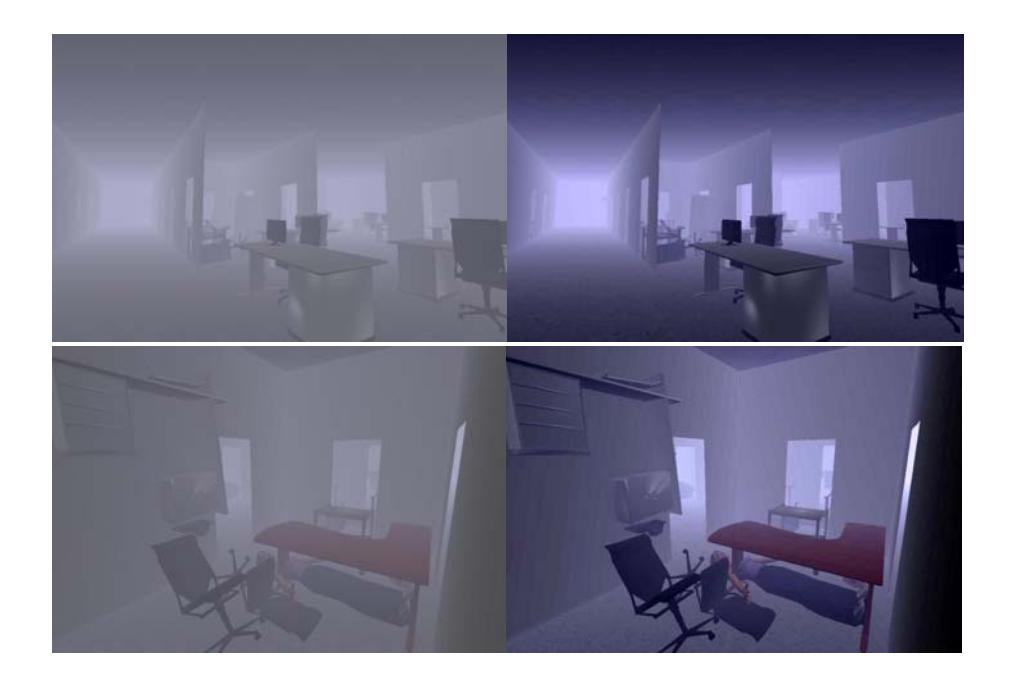
At disaster areas, the images coming from robot cameras can be very problematic because of the dust, the darkness and the smoke. The same problems exist in the simulation platform. The images coming from robot cameras were investigated on the 2011 competition maps. We noticed that the number of unique colors is very low. In other words, the color histograms are very narrow. This situation reduces image understanding capabilities of the user. To solve this problem, we applied contrast stretching algorithm for each color band (R, G, B). Equation 1 was used to set the color values into 0-255 interval.
$$newP = \frac{currP - \min P}{\max P - \min P} * 255$$
In Equation 1, newP is the new value of pixel, currP is the current value of pixel, maxP and minP are the maximum and minimum values of all pixels respectively. In
Fig. 5, the results of the contrast stretching algorithm are given. The original images are at the left side. The processed images are at the right side.
In Fig. 5, it can be seen that the processed images are more understandable than the original ones.
7 WayPoint Control
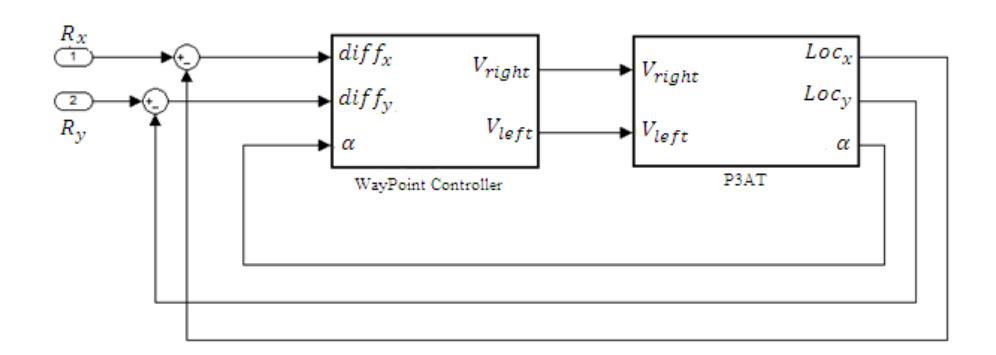
The point determined by the operator and at which the robot needs to go on the map is called WayPoint [7]. The robot must go to the WayPoint automatically. For this purpose, P3AT robot's left and right wheel speeds are calculated according to the theory of Proportional Control [8]. The block diagram of WayPoint Controller is shown Fig. 6.
Waypoint Controller is a function that has 3 inputs and 2 outputs as shown in Fig. 6. The relationship between inputs outputs are given at Equations 2 and 3.
$$V_{left} = v + K_p \cdot \left(\alpha - \tan^{-1} \left(diff_y / diff_x\right)\right)$$
$$V_{right} = v - K_p \cdot \left(\alpha - \tan^{-1} \left(diff_y / diff_x\right)\right)$$
Locx Locy α, , are the values of P3AT's direction angle, x location and y location respectively. Rx Ry , are the locations of the WayPoint. Diff x Diff y , are the differences of robot location with respect to the waypoint location. v is the function of Euclid distance of robot and waypoint which called base velocity. Kp is the coefficient of proportional control. Both function v and scalar Kp are determined empirically.
8 Moving Object Detection by P3AT's Mobile Camera
While some victims on the area do not have any motion, most of them do have small movements. With this module moving objects (most of them thought to be a victim) can be determined automatically.
1 , t t− I I are images of P3AT's camera at time t and t-1 respectively. t−1 f is n unit feature point's x and y coordinates at image t−1 I , extracted by Lucas Kanade method [9]. t f is the feature vector at image t I , extracted by tracking t−1 f features. The
coefficients of the best transform matrix that transforms $f^{t-1}$ to $f^t$ , are determined using least square error. The form of transform matrix is given in Equation 4 [10].
$$\begin{bmatrix} \hat{f}{x}^{t} \ \hat{f}{y}^{t} \end{bmatrix} = \begin{bmatrix} a_{0}.f_{x}^{t-1} + a_{1}.f_{y}^{t-1} + a_{2}.f_{x}^{t-1}.f_{y}^{t-1} + a_{3} \ a_{4}.f_{x}^{t-1} + a_{5}.f_{y}^{t-1} + a_{6}.f_{x}^{t-1}.f_{y}^{t-1} + a_{7} \end{bmatrix}$$
$\hat{f}^t$ is the estimation of $f^t$ which have minimum estimation error. To estimate $\hat{f}^t$ , all coefficients (eight units in total) must be determined by least square error [11]. Error function (J) of being minimized by least square is given at Equation 5.
$$J = \frac{1}{2} \cdot \sum_{i=1}^{n} \left| f^{t} - \hat{f}^{t} \right|^{2}$$
In Equation 5, the operator represents the Euclid distance.
When the best transform coefficients are found; feature points prediction error above a certain threshold determines moving object feature and feature points prediction error below a certain threshold determines static environments feature. The threshold value is determined empirically.
9 Communication Protocol
To fully explore and map the area and to find victims, all robots have to be in communication with ComStation at any moment. If ComStation do not access any of the robots, these robots do not receive operator's command. As a result, the robot is forced to act completely autonomous. Thanks to the wireless communication protocol server [12], ComStation generally keeps communicating with other robots.
Robots communicate with each other through the WSS in USARSIM, hence each robot called as mobile wireless sensor, and the network which consists of robots and the ComStation is called as wireless sensor network [13].
Routing algorithm is the most important step in communication protocol and the path way of message packet from source to target determined by routing algorithm [14]. When WSS works on noop-propagation mode, all the robots are always in communication with each other and ComStation that established a direct link with the
source message to be transmitted to the target robot. But in other propagation modes, the message should go to the destination by the way of hops.
Blind Flooding routing algorithm is one of our routing methods. According to this method, all messages forwarded to all robots by source node. When any node receives a message, first controls the original receiver of this message. If this message is node's own message then node receives the message and processes it. If the receiver of the message is another node, the message is broadcasted to all nodes [14].
Advantage of this method is that the intended receiver will receive the message from different sources, so the transmission is assured. Despite this advantage of the method, there are two important disadvantages;
- The same message goes to the destination at different times, by the way of different interval hops. There might be confusion if the old copies of the message are processed as new
- Network bandwidth is not used efficiently because of unnecessary messaging.
To cope with the first disadvantage of the method, a message ID is added into message format. Each node keeps a local look-up table which consist of processed message IDs. If an incoming message ID is not available in the look-up table, then the message is processed, otherwise the message will not be accepted. Since the ID must be unique, ComStation message IDs are selected as sequence of odd numbers. IDs of the messages created by nodes consist of even numbers. Unfortunately, currently there is no solution for inefficient bandwidth using.
A dynamic routing table will be implemented in future; the message type field is created in message format for this purpose. Our message format is shown in Fig. 7.
SZ : Message size consists of 3 byte. ID : Message ID consists of 2 byte.
TYP : Message type consists of 1 byte. 1 stands for routing only receivers, 2
stands for blind flooding, 3 stands for dynamic routing table.
TRG : Target node ID consists of 1 byte. SRC : Source node ID consists of 1 byte.
HOPn : Message packets are transferred by the way of hops. This field refers to internal hops ID.
* : Special characters representing the message begining. It consists of 1 byte.
MSG : Contents of the message.

8 Conclusion
In this paper, we give an overview of our team's design decisions. Modules that construct the system are specified and tried to be analyzed. The experience, we hope to gain from virtual robot competition, will allow us to improve our algorithms. This experience will also contribute our work on real robots.
References
- Thrun, S., Burgard, W. and Fox D.: Probabilistic Robotics, The MIT Press, Cambridge, Massachusetts, 2005
- Wang, J., Balakirsky S., USARSim-manual_3.1.3
- Özışık O., Yavuz S.: An Occupancy Grid Based SLAM Method", IEEE Computational Intelligence for Measurement Systems and Applications (CIMSA 2008), İstanbul, 2008
- Kurt Z., "Development of Intelligent SLAM Algorithms, Master Thesis, Yıldız Teknik Üniv., 2007
- Özışık O.: Simultaneous Localization and Mapping with Robot Team, Master Thesis, Yıldız Teknik Üniv., 2010
- M. Montemerlo, S. Thrun, D. Koller, and B. Wegbreit. FastSLAM: a factored solution to the simultaneous localization and mapping problem. In Proceedings of the AAAI National Conference on Artificial Intelligence, p. 593-598, 2002
- P. Velagapudi, P. Scerri, K. Sycara, H. Wang, M. Lewis, and J. Wang, "Scaling effects in multi-robot control," 2008 IEEERSJ International Conference on Intelligent Robots and Systems, pp. 2121-2126, 2008.
- B. C. Kuo, Automatic Control Systems. Wiley, 1995, p. 898.
- B. D. Lucas and T. Kanade, "An iterative image registration technique with an application to stereo vision," International Joint Conference on Artificial Intelligence, vol. 130, no. x, pp. 674-679, 1981.
- B. Jung and G. S. Sukhatme, "Detecting Moving Objects using a Single Camera on a Mobile Robot in an Outdoor Environment," Processing, pp. 980-987, 2004.
- H. W. Bode and C. E. Shannon, "A Simplified Derivation of Linear Least Square Smoothing and Prediction Theory," Proceedings of the IRE, vol. 38, no. 4, pp. 417- 425, 1950.
- M. Pfingsthorn, "RoboCup Rescue Virtual Robots: Wireless Simulation Server Documentation," October, pp. 1-8, 2008.
- S. A. Munir, B. Ren, W. Jiao, B. Wang, D. Xie, and J. Ma, "Mobile Wireless Sensor Network: Architecture and Enabling Technologies for Ubiquitous Computing," Network, vol. 2, pp. 113-120, 2007.
- A. S. Tanenbaum, Computer Networks (4th Edition), no. 2. Prentice Hall, 2002, p. 912.