The DAInamite 2009 Team Description
Holger Endert, Thomas Karbe, Jens Krahmann, Frank Trollmann
DAI-Labor, TU Berlin Faculty of Electrical Engineering and Computer Science; Technische Universität Berlin Faculty of Electrical Engineering and Computer Science
Abstract This paper provides an overview over the ongoing work on the DAInamite agent framework and also highlights our current research focus. First sketch our new coordinated passing and positioning algorithm, which is based on Voronoi diagrams. Afterwards, we analyse in how far learning and predicting opponent positioning-behaviours is advantageous w.r.t. improving the accuracy of an agents worldmodel. Finally, some effort was spent on adopting to the recent server version, in particular to the new dash-model.
1 Introduction
The DAInamite agent framework has experienced a major refactoring in the last year. In that, the main work has been spent on the clear design of the agent architecture [1]. However, during the last RoboCup we noticed that a few skills and features behaved sub-optimal. For instance, although our passing algorithm tends to compute valid and secure passes, it lacks in potential for coordination with possible pass-receivers and often results in situations, where no good further options were available. In order to address this issue, we implemented a passing algorithm that builds upon Voronoi diagrams and led to promising results in our tests so far. We therefore sketch our passing approach in Section 2.
We also noticed that using a model for an opponents positioning behaviour improves the accuracy of the worldmodel in general. This results from the fact, that players sometimes are not seen for a certain amount of time, and furthermore the visual information received may be incomplete. We outline our experiments on estimating the position of opponents in Section 3.
Finally we spent a lot of work in adopting to the changes of the soccer server, in particular to the new dash-model. Since in the current server version the new model can be used as well as the old model we analysed both of them. The results are compared in Section 4.
2 Passing and Positioning Based on Voronoi Graphs
Passing is one of the most crucial skills in RoboCup. Without sufficiently elaborated passing skills, a team cannot play successful soccer. It also reflects the cooperative nature of the game. While a few publications already address this issue (e.g. [2]), we felt that none of them tackles all the relevant aspects adequately. For instance, our previous algorithm was basically a search in the space of kick-actions, limited to a reasonable number. Though it found good passes in some cases, it had the following disadvantages:
- Passes could not (or badly) be assessed w.r.t. the following options of the pass-receiver.
- The pass-receivers could't use the algorithm as well. As a consequence, they could not estimate, which positioning behavior could be beneficial for supporting passes.
- A lot of kick-actions were analysed, which are per se not interesting. Furthermore, promising kick-actions were analysed with the same level of detail as the others.
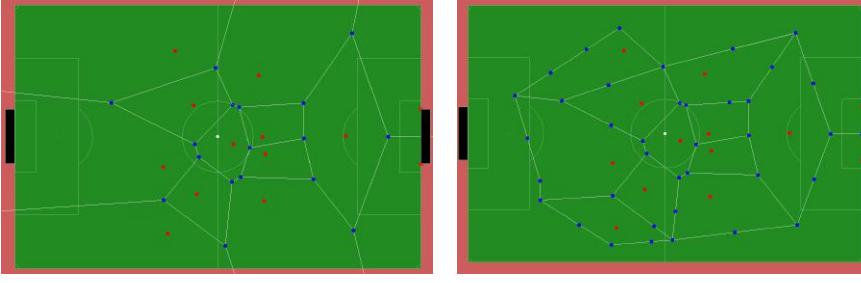
Voronoi diagrams have been used in RoboCup for a while, e.g. in [3] or [4]. The most approaches focused on the positioning problem, i.e. where to move when not in ball possession. We argue, that Voronoi diagrams can be used in a more general way. On the one hand, they can limit the space of possible passes to meaningful options. On the other hand, they can be used by possible passreceivers to reason on positioning. The idea is presented in Figure 1(a). There, a Voronoi graph is built around opponent players (marked as red dots). As can be seen, the edges provide ways through the opponents. By definition, each point on each line is equally far to the next opponent, which serves as a good basis for finding interesting pass-directions. Furthermore, when including the goal posts of the opponent, the Voronoi graph is connected to the goal by at least one edge. Vertices can be assessed by the number of outgoing edges and the distance to the goal as well, leading to goal-directed analysis. Finally, both the pass-givers and the pass-receivers can make use of the diagram. Computing assignments, closely located pass-receivers can be matched onto free vertices (marked as blue dots), supporting the pass-giver by increasing the number of promising pass-options.
So far, our approach shows good results. We implemented a fast algorithm for computing the graph [5], and extended this with further - soccer related options (see e.g. in Figure 1(b)). However, some more work can be spend, for instance on finding (or learning) assessment functions for selecting the optimal pass.
3 Learning Opponents Positioning-Behaviour
Having an accurate worldmodel in the RoboCup domain is a requirement to the achievement and maintenance of the agent's goals and provides the foundation for sound agent behaviour. Although our team uses some state of the art techniques for incorporating information from sensor data (e.g. a particle filter [6] for self localisation), we include only few estimations on those parts of the field, that have not been seen. For instance, extrapolation of the ball is quite simple, because it cannot change its movement while not kickable by players. The players on the other hand are relatively free, and making estimates on their movement is quite difficult. This counts at least for the opponents team, since their movement behaviour is completely unknown.
We noticed that incorporating knowledge about the positioning behaviour of teammates already improves the worldmodel. Thus we investigated the idea of predicting that of opponents as well. To this end, we followed a similar approach as in [7], where the home-positions and ball-attraction vectors of players were estimated by means of linear regression. We used neural networks to learn the general movement vector for players in specific situations. We analysed the games of the last championship, trained predictors for each participating team, and evaluated their influence on the worldmodel of our agents w.r.t. to the estimated positions of the opponents. The results are shown in Table 1. The column with Seen Values shows data without predictions. The next shows the results of our simple, Handcoded Predictor, followed by the learned one. As can be seen, for most teams, the worldmodel accuracy increased most with the learned prediction units. However, best improvements were made for teams with relatively static positioning behaviour. Dynamic roles and changes in the positioning behaviour during the championship led to small improvements for some teams, and even to a decrease in accury for AmoiensisNQ. It is planned to extend our approach by detecting role changes and exploiting further relevant correlations.
Table 1. The average opponent position errors ordered by team an method.
| Teamname | Seen Values | Handcoded Predictor | Learned Predictor |
|---|---|---|---|
| AmoiensisNQ | 2.53m | 2.44m (3.5%) | 2.59m (-2.4%) |
| Brainstormers | 2.34m | 2.27m (3.0%) | 2.19m (6.5%) |
| DAInamite | 2.86m | 2.62m (8.4%) | 2.29m (20.0%) |
| NCL08 | 3.00m | 2.93m (2.5%) | 2.04m (32.0%) |
| OPU hana | 1.90m | 1.89m (0.5%) | 1.60m (15.8%) |
| Oxsy | 2.22m | 2.13m (4.0%) | 1.94m (12.8%) |
| WE2008 | 2.14m | 2.12m (1.0%) | 1.93m (9.8%) |
| HELIOS2008 | 3.12m | 3.01m (3.5%) | 1.96m (37.2%) |
4 Analysis of the new Dash Model
Since version 13 of the soccer server, an altered dash-model is available. In the previous versions, the player agents were only allowed to accelerate forwards and backwards. This enforced them to turn their body in case they must reach a position that is not directly in front or behind them. The new version enables them to accelerate sideways, thus increasing the possible dash directions to four. On the other hand, the effectiveness of the backward and side dashes has been decreased. While dashing backwards is only 50 % as fast as dashing forwards, a sideward acceleration is even less effective (only 25 %). Hence, the question for the usefulness of these new options arises, especially as in the current implementation of the server, the old model is still usable. Since the fast reachability of positions is crucial for a teams performance, we analysed the new dash-model and compared it to the old version.
Table 2. Parameter Settings of the Dash Models
| Model | Dash Angle | Step Back Dash Rate | Side Dash Rate |
|---|---|---|---|
| Current Model | 90 | 0.5 | 0.25 |
| Old Model | 180 | 1.0 | - |
| Proposal | 45 | 0.5 | 0.25 |
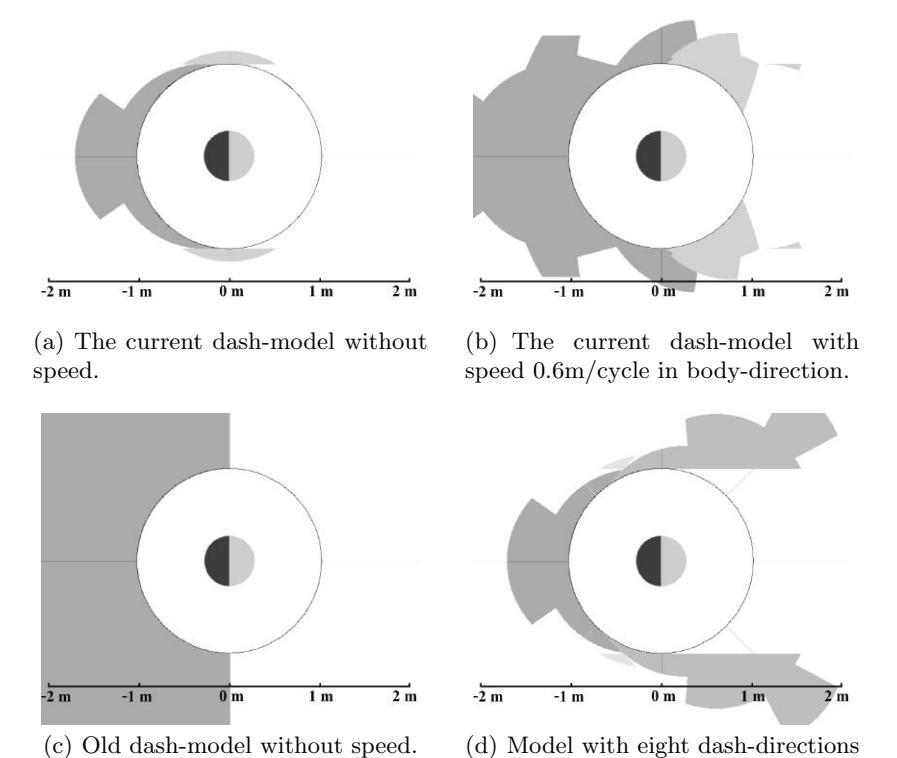
After implementing the new dash-model, we tested and visualised its properties with different configurations. These configurations are depicted in Table 2. The results can be seen in Figure 2. In that, we assume a given player that conforms to the standard (average) player type. The upper row shows the current (new) model without and with initial speed. The lower row shows the old model and a model based on eight directions. Every point outside the players kickable margin is colored according to the best angle of the first dash action used for reaching it. Points that can be reached in an equal amount of cycles are evaluated w.r.t. the resulting distance to the player relative to the size of the kickable margin, such that turning and then dashing forward is generally the favoured option.
As can be seen, in the current dash-model (Figure 2(a)) any dash-action other than dashing forward is of relatively useless. However, due to the players inertia, they become more useful (Figure 2(b)) when in movement. On the other hand, the old dash-model does not make any difference in dashing back or forward (stamina is neglected here, Figure 2(c)). A dash-model with eight directions and the current configuration for dash-power is given in Figure 2(d). We noticed that, using our assumptions, the player never uses the directions +/-135°, and the side-dashes disappear even more compared to the current version with four directions. In summary, we think that the new dash model seems to be worth considering only within a close range to the players body. While this is realistic, it contradicts a little with the old dash-model. In the current implementation, it is optimal to use the best properties of both models.
Finally we note, that we tested several other parameter settings, for instance an increased side- and back-dash power. But for the sake of briefness we omit the results here. Additionally, assessing the movement strategy with other parameters must be considered as well. For instance, an agent may prefer a side-dash instead of turning and dashing forward, because this will leave his body-direction in the original state.
5 Conclusion and Future Work
In summary, the techniques introduced in this paper offer some interesting opportunities for research and improved team performance. The passing algorithm and the estimation of opponents positioning-behaviour already showed good results. We furthermore hope to provide some interesting insights into the new dash-model. We think that in general the simulation league will benefit from the new model, but as always, finding optimal configuration is quite hard.
In future, we plan to exploit the properties and advantages of the two approaches we have presented. The passing algorithm will be extended towards planning (small) sequences of passes, e.g. a one-two-pass. The opponent modelling approach is extensible in many ways. However, the first step will be to include the detection of role-changes.
References
- Endert, H., Karbe, T., Krahmann, J., an Frank Trollmann, N.K.: The dainamite 2008 team description (2008)
- Kyrylov, V.: Balancing gains, risks, costs, and real-time constraints in the ball passing algorithm for the robotic soccer. In: RoboCup. (2006) 304–313
- Akiyama, H., Noda, I.: Multi-agent positioning mechanism in the dynamic environment. RoboCup 2007: Robot Soccer World Cup XI (Poster) (2008) 377–384
- Nakanishi, R., Murakami, K., Naruse, T.: Dynamic positioning method based on dominant region diagram to realize successful cooperative play. RoboCup 2007: Robot Soccer World Cup XI (als Poster) (2008) 488–495
- de Berg, M., Cheong, O., van Kreveld, M., Overmars, M.: Computational Geometry. Third edition edn. Springer Verlag, Berlin, Heidelberg (2008)
- de Boer, R., Kok, J.: The incremental development of a synthetic multi-agent system: Theuva trilearn 2001 robotic soccer simulation team. Master's thesis, University of Amsterdam, The Netherlands (2002)
- Kuhlmann, G., Knox, W.B., Stone, P.: Know thine enemy: A champion RoboCup coach agent. In: Proceedings of the Twenty-First National Conference on Artificial Intelligence. (2006) 1463–68