KickOffTUG - Team Description Paper 2010
Stephan Gspandl, Werner Arnus, Julia Gebetsberger, Gerwin Gsenger, Andreas Hechenblaickner, Michael Reip, Christian Wagner, Máté Wolfram, Christoph Zehentner
Institute for Software Technology, Graz University of Technology, Inffeldgasse 16B/II 8010 Graz, Austria
Abstract This paper describes the current efforts and achievements of the 2D RoboCup Simulation League team KickOffTUG in research, agent development as well as contributions to the community.
The team's research focus comprises behaviour modelling and adaption of agents or robots by means of intuitive user interfaces. We have thus proposed a system to transform tactics graphs from books on soccer strategies or tablet-pcs and digital whiteboards into behavioural plans. This should be as intuitive and easy as sketching on paper. The first direct approach utilizes the team's predicate implementations as domain model. These are the agents' logic foundations to evaluate each world state they could encounter and chose an appropriate action accordingly. The combination of all true predicates yields the description of a sketch. Furthermore we have been constantly improving how the agents perceive their surroundings. Efforts to enhance the self model by Kalman filters are demonstrated in empiric results.
1 Contributions
KickOffTUG is highly active in the RoboCup community. The following activities
- As part of the OC for 2D RoboCup Simulation League, we are trying to improve qualification and tournament processes.
- Andreas Hechenblaickner has implemented a modern league manager to simulate tournaments effectively.
- KickOffTUG has revived the Soccer Simulation Internet League as testbed for teams to compete off-season.
- KickOffTUG is promoting RoboCup in Austria successfully. The assistance in RoboCup 2010, supporting programme in various public congresses and the award for best scientific communications for our participation in the 'Lange Nacht der Forschung' (Night of Research) are examples we are very proud of.
- The 2D RoboCup Simulation League is used as experimental testbed for various courses at Graz University of Technology, as well as for European educational events and internships.
2 From Sketch to Plan
In each RoboCup soccer league it is very important to build up soccer domain knowledge and how this is done. In most teams this is a time-consuming and laborious job of transforming soccer tactics (esp. from books like [1] or [2]) or other concepts into specific models, plans or source code. This causes many hybrid and imcompatible descriptions of the same ideas making exchange and mutual improvments virtually impossible.
We think adapting the agents' behaviour should be as simple, fast and intuitive as scribbling on a piece of paper or scanning diagrams. As a matter of fact, we believe that this should be true for any interaction with a machine. Therefore, we are constantly working on a system for an easy translation of dynamic sketches (i.e. sketches that not only contain graphic information but also the chronological order of strokes) into behavioural descriptions.
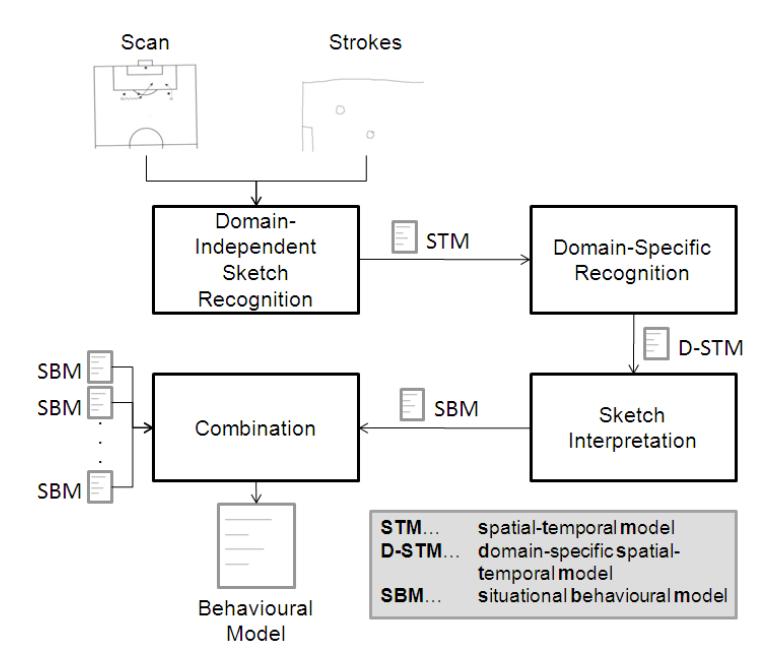
In the special case of RoboCup the input to the system is a graph (a scan) or a seqence of strokes depicting an agent's behaviour in a concrete situation. As 1 illustrates generally, this approach is based on several transformations and models of representation. In the first stage we recognize the tactics graph and translate it to a spatial-temporal representation of the described situation. This model typically contains a set of circles representing the own, the opposing players and the ball and a set of different arrows standing for the actions to be performed by the players, respectively. By using a domain-model the spatial-temporal model is then transformed into a domain-specific situation model. This model in turn comprises a set of literals describing the situation given by the strategy graph, the actions which are applied to this situation and a set of conditions describing the situation after application of the actions. A combination of such strategic models creates an overall model of the agents' behaviour.
In the first version of development, we have introduced a Matlab script and an extention to our project tool to perform the first and second stage of transformation. In order to derive a representation of a given sketch we employed the predicates implementations of our agent code as a domain model for sketch interpretation. In the following this approach is discussed and first empiric results are presented.
2.1 Introduction
In each RoboCup soccer league it is very important to build up soccer domainknowledge and how this is done. In most teams this is a time-consuming and laborious job of transforming soccer tactics (esp. from books like [1] or [2]) or other concepts into specific models, plans or source code. This causes many hybrid and imcompatible descriptions of the same ideas making exchange and mutual improvments virtually impossible.
We think adapting the agents' behaviour should be as simple, fast and intuitive as scribbling on a piece of paper or scanning diagrams. As a matter of fact, we believe that this should be true for any interaction with a machine. Therefore, we are constantly working on a system for an easy translation of dynamic sketches (i.e. sketches that not only contain graphic information but also the chronological order of strokes) into behavioural descriptions.
In the special case of RoboCup the input to the system is a graph (a scan) or a seqence of strokes depicting an agent's behaviour in a concrete situation. As 1 illustrates generally, this approach is based on several transformations and models of representation. In the first stage we recognize the tactics graph and translate it to a spatial-temporal representation of the described situation. This model typically contains a set of circles representing the own, the opposing players and the ball and a set of different arrows standing for the actions to be performed by the players, respectively. By using a domain-model the spatial-temporal model is then transformed into a domain-specific situation model. This model in turn comprises a set of literals describing the situation given by the strategy graph, the actions which are applied to this situation and a set of conditions describing the situation after application of the actions. A combination of such strategic models creates an overall model of the agents' behaviour.
In the first version of development, we have introduced a Matlab script and an extention to our project tool to perform the first and second stage of transformation. In order to derive a representation of a given sketch we employed the predicates implementations of our agent code as a domain model for sketch interpretation. In the following this approach is discussed and first empiric results are presented.
2.2 Deriving the representation of a sketch
We have implemented a first approach of automatically recognizing and interpreting a sketch in RoboCup. The sketches, recognized by the Matlab scanrecognition module, are translated directly into our plan tree notation for agents' behaviours. This is an adpation of T-R-Programs (see [3]) combined with the STRIPS notation (see [4]). A plan tree comprises action nodes and subplans. An action node in turn consists of several sets of predicates (pre-, post-conditions and invariants), an action symbol and parameters to this action. To find a decision the agent depth-searches the tree to find a node whose post-conditions are false, but pre-conditions are true. This denotes, that the effects of an action has not yet been fullfilled, but the action (i.e. the grounded action symbol) can be executed (with the given parameters). Invariants help to maintain deliberativity of a decision as an action is executed as long as the invariant remains satisfied. In order for the agent to be reactive, the tree is traversed from the root otherwise (thus, the whole search space is again examined). For a detailed report on KickOffTUG's decision-making see see [5], [6] and [7].
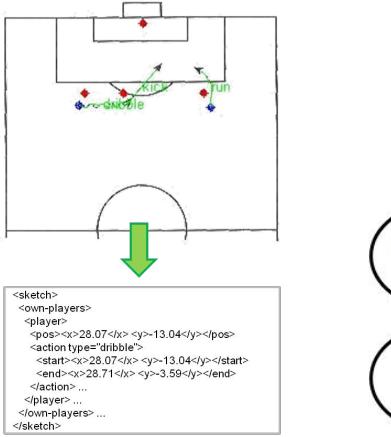
At the moment input to the system can either be a drawn or scanned static sketch or a situation put together graphically with a few clicks in a new frame of our project tool. Both provide entities already recognized to the interpretation. These tools are only the first step to a fully-integrated sketching system, which has yet to be implemented. A possible input would thus be from [1] like the example shown in Fig. 2.
Thus, a simple domain-specific spatial-temporal model with players and the ball recognized and annotated with field positions as well as actions to be performed is handed over to the interpretation. A concrete result of the recognition is shown in Fig. 2 as well.
The interpretation is based on the predicates our team has implemented to evaluate each situation our agents could encounter. Examples would be the predicates hasBall(A), checking whether an agent A is in ball possession, or passP ossible(X, Y ), examining whether agent X can safely pass to agent Y . Applying this as domain yields a qualitative description of a given tactics situation. Simply spoken, this description is currently derived by executing the predicate implementations with all reasonable parameter combinations on the input model. The combination of the symbols of all true results provide the pre-conditions of the depicted tactics situation. Depending on the action to be performed, the post-conditions and invariants are compiled accordingly. Fig. 3 yields the resulting plan of the transformation process for the given example.
In the simplest case this qualitative model will be directly inserted into an overall plan tree by attaching it as sibling. As each situation broadens the tree further, this will probably turn out to be very inefficient. Therefore, techniques to deepen the tree have to be implemented. One approach would be binary ramification, i.e. using common predicates as anchor points to ramify the tree.
2.3 Experiments
We have set up a series of experiments using our team KickOffTUG as environment to elaborate the two questions whether
- this process is promising, extrapolating from this first approach
- an existing domain-model can be applied to perform the third stage 'Interpretation' of the sketching process
In our experiments we only consider goal-preparing or offensive situations, i.e. situations in which the ball is near the opponent goal and our team is in ball possession. From each sequence of possible situations, we draw three by chance. The resulting set serves as 'knowledge input' to our interpretation. Again each situation already comprises a spatial-temporal model for the soccer domain, so there is no need to preprocess it in terms of the first and second stage of the transformation process.
Next, the set of predicates of our team serves as grounding domain for interpretation. Each condition is evaluated over all combinations of entities of each situation and each entity and the result stored as preconditions to a new plan, and thus yields a set of plans.
This set of plans is the test set which is evaluated over 15 test games in the following way: The decision-making is presented with each offensive situation from the logs. Thus, the set of plans is searched for those plans whose preconditions are true for the given situation. This is called a hit. The set of plans is then sorted by hits and similiar plans are resolved heuristically to ensure the quality of the plans.
The resulting set of plans is then evaluated in two ways. In a first experiment, they are evaluted over fifteen further test games in two steps:
- The plan coverage is calculated by checking how many offensive situations can be covered with various selections from the plan set.
- The plan quality is computed by comparing whether the hitting situations resemble the original from which the plan was created.
In a second experiment, the plan quality is determined statistically by simulating a tournament of 100 games. The 12 derived plans are connected to our standard plan in a way they are examined first when searching for a decision. Furthermore, an appropriate action has been added to each plan. This means, whenever a plan hits, the according action is executed. The better the situation has been modeled, the better the influence of the action should be on the score. On this base, 50 games have been simulated with sketch plans and 50 without.
The logfiles are then evaluated offline. Each set of 50 games is recalculated. Whenever a hit occurs, the logs are checked whether the offensive situation as described by the plan has had (for simulations with sketch plans) or would have had (for simulations without sketch plans) an influence on the score. On both sets the ratio between the number situations resulting in a goal and the overall count of hit situations is calculated and compared. We can thus see, how the test plans performed in the modelled situations against what to expect from the standard plans.
2.4 Results
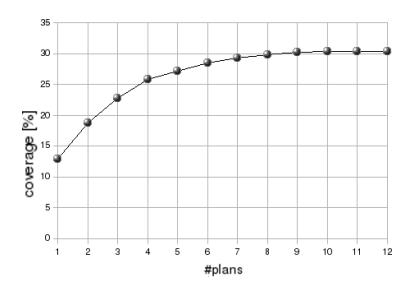
Results of our tests showed that we are indeed able to describe soccer situations in 2D RoboCup Simulation League automatically with the aid of an existing set of conditions as model. In order to provide deployable plans for the Simulation League team, manual post-processing of the plans or adaptions of the model are yet necessary in this simple setup. Fig. 4 shows the accumulated plan coverage for twelve plans derived by the previously described process and sorted by their extent of contribution. In total it is possible to achieve a coverage of 30.3 percent of all offensive situations with only 12 plans.
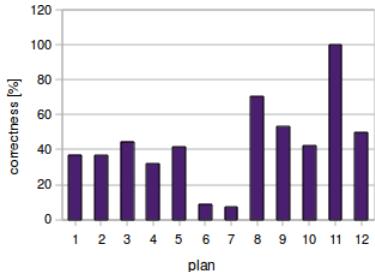
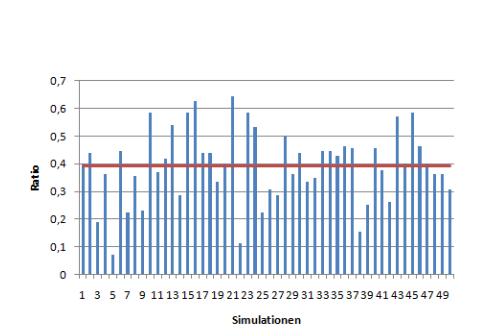
Concerning quality of the plans, we have tested the resemblance of hitting situations to the original. Experts have rated whether a situation was correctly classified or not. Fig. 5 depicts their ratings on the twelve plans. In total 43.69 percent of situations were classified correctly. To further increase classification results specific conditions have to be introduced based on these results.
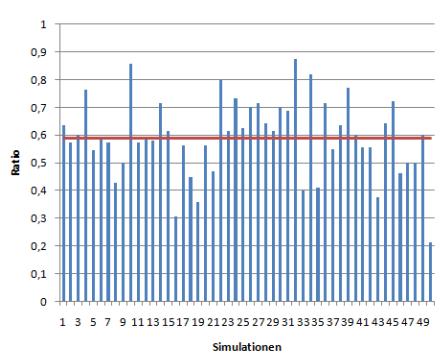
Results of the second experimental setup illustrate the quality by simulation. Fig. 6 shows the results of the experiments, i.e. the ratios of situations that contributed to a goal to all that occured over 50 games, simulated with and without sketch plans. Again, an average of 39 percent compared to 59 percent combined with the manual evaluation of situations conveys that the modelling was successful for most cases, but still could be improved. This value will be used as characteristic value to rate further improvements.
3 Self Model
The better the world model, i.e. the agent's believes about its surroundings, the better the decisions it can make. This is why KickOffTUG is constantly trying to improve how sensor information is incorporated. This applies to how an agent sees itself, but also the positions, movements and decisions of the own as well as opposing team. The following describes current efforts made in measuring and filtering all information concerning the self model briefly.
3.1 Introduction
The better the world model, i.e. the agent's believes about its surroundings, the better the decisions it can make. This is why KickOffTUG is constantly trying to improve how sensor information is incorporated. This applies to how an agent sees itself, but also the positions, movements and decisions of the own as well as opposing team. The following describes current efforts made in measuring and filtering all information concerning the self model briefly.
3.2 Calculations
The Self Model determines the position and velocity of the agent. Each send step the server transmits vision sensor information to the agent. This message contains following measurements of the flags and lines, which are within the viewing cone of the agent:
- distance
- direction
- distance change
- direction change
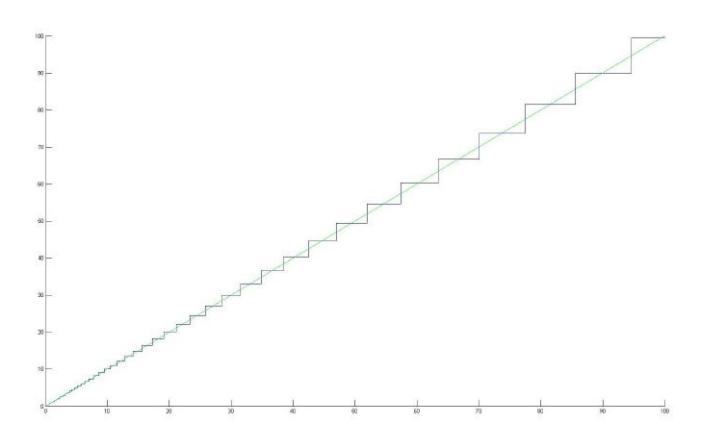
Each measurement is quantized. The angle is rounded (rint) to the nearest integer value. The degree of the quantization of the distance ascends with the length of it. In Fig. 7 the quantization of the measured distance of a player is plotted, as the quantization step of the landmarks are smaller.
In order to calculate the agent's own position at least one line and two flags are required. With this information the following calculations are performed:
- The body facing direction is calculated with the help of the lines and the absolute head facing direction is determined.
- With the help of two flags and the absolute head facing direction the position of the player is derived.
- The remaining flags are used to correct this position as well as the body facing direction of the agent.
- The player's velocity is calculated.
3.3 Extended Kalman Filter
The EKF is a state estimator. Compared to the standard Kalman filter it can been be used for nonlinear systems by linearizing the mean and covariance values (see [8]). Having Extended Kalman Filters (EKF) successfully applied to robot self-localization, we have incorporated it into our team to filter measurements. To illustrate how the EKF works, the position measurement update with one flag is shown as example.
Covariance and the state vector are initialized with the results of the two flag measurement as above. The state vector for a one flag measurement contains the position (x, y) and body facing direction $\theta$ of the robot:
$$\hat{x}_k = \begin{pmatrix} x \ y \ \theta \end{pmatrix} \tag{1}$$
The EKF is updated with the help of each flag measurement. Let z be the measurement of the absolute distance and angle to the flag. The covariance matrix R for the measurement contains the variance of this distance and angle.
$$z_k = \begin{pmatrix} d_{flag} \ \theta_{flag} \end{pmatrix} \tag{2}$$
$$R = \begin{pmatrix} \sigma_d^2 & 0\ 0 & \sigma_\theta^2 \end{pmatrix} \tag{3}$$
The predicted measurement is then calculated as followed:
$$h(\hat{x}) = \begin{pmatrix} \hat{d}{flag} \ \hat{\theta}{flag} \end{pmatrix} = \begin{pmatrix} \sqrt{(f_x - x)^2 + (f_y - y)^2} \ atan(\frac{(f_y - y)}{(f_x - x)}) - \theta \end{pmatrix}$$ (4)
The Jacobian of the predicted measurement is the derivation with respect to the state:
$$H_{k} = \frac{\partial h}{\partial x}|{\hat{x}{k}} = \begin{pmatrix} \frac{\partial \hat{d}{flag}}{\partial x} & \frac{\partial \hat{d}{flag}}{\partial y} & \frac{\partial \hat{d}{flag}}{\partial \theta} \ \frac{\partial \hat{\theta}{flag}}{\partial x} & \frac{\partial \hat{\theta}{flag}}{\partial y} & \frac{\partial \hat{\theta}{flag}}{\partial \theta} \end{pmatrix} = \begin{pmatrix} -\frac{f_{x} - x}{d_{flag}} & -\frac{f_{y} - y}{d_{flag}} & 0 \ \frac{f_{y} - y}{d_{flag}} & -\frac{f_{x} - x}{d_{flag}} & -1 \end{pmatrix}$$ (5)
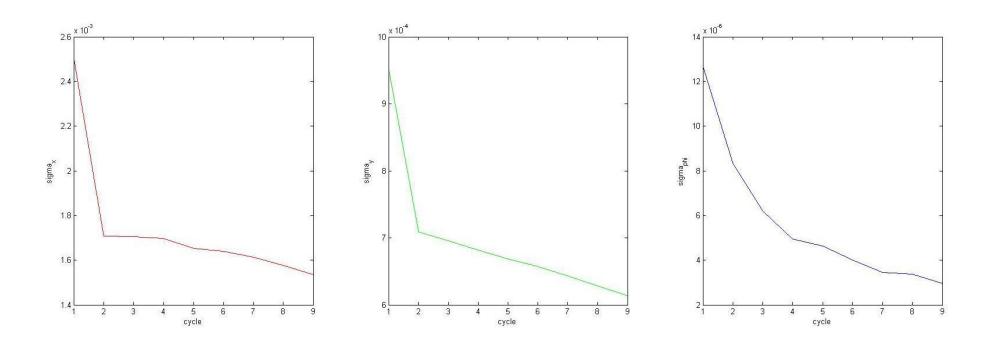
With every measurement update of the EKF the variance (compare Fig. 8) of the robot position and body facing direction declines. This means that the value of the state becomes more precise and trustworthy.
3.4 Experiments
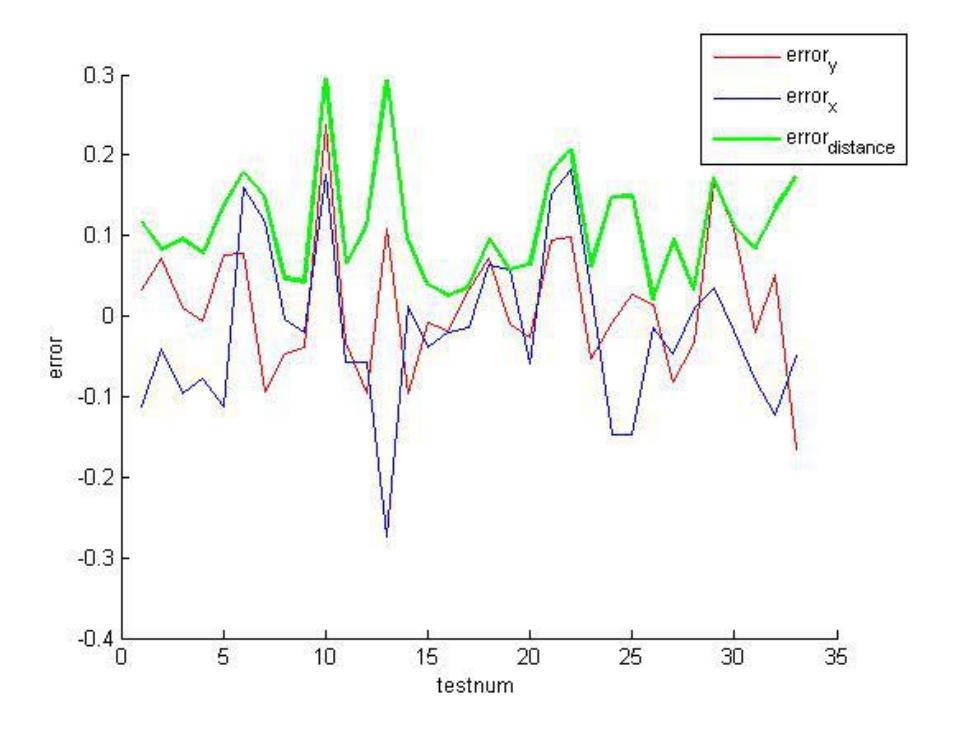
An experiment was designed to test the self model. It generates random positions and calculates noisy flags and lines. The data of this test set is used to call the position calculation routines. The estimated output concerning position and body facing direction is compared to the correct values and thus, the error values are derived.
In Fig. 9 these values are outlined. In this figure the error of the calculated position to the correct is plotted. The differences of x- and y-coordinates are shown in blue and green respectively. The green line conforms to the the euclidean distance beween the calculated position and the real one.
The overall results of our tests are:
– Body Direction
– max: 1.34 – mean: 0.144 – dev: 0.091 – examples: 9336
– mean of examples: 0.144
– Position
– max: 0.92 – mean: 0.112 – dev: 0.062 – examples: 9336
– mean of examples: 0.112
For the given amount of examples, the error of the calculated body facing direction and the correct one is about 0.144 degree and the distance of the calculated position to the real one is about 0,112 meters. As can be seen, the mean error values are quite good, although some greater drifts (max values) could appear.
4 Conclusion
We have presented the efforts of KickOffTUG in the past year concerning community contributions, research as well as team improvements. KickOffTUG has been very active promoting and fostering RoboCup in Austria and support the league to develop. Relating to research we have developed a first version of a sketch interpretation mechanism that will improve human-robot interaction and behaviour modelling. In the next steps, research into model-based diagnosis and recommender systems performed at the Institute for Software Technology will develop the methodology. Last, we presented empiric results on our research into filtering techniques to optimize the agents' perception of their surroundings.
References
- Bangsbo, J., Peitersen, B.: Offensiv Spielen. Verlag Hovedland (2000)
- Lucchesi, M.: Coaching the 3-4-1-2 and 4-2-3-1. Reedswain Publishing (2002)
- Nilsson, N.J.: Teleo-reactive programs for agent control. Journal of Artificial Intelligence Research 1 (1994) 139–158
- Nilsson, N.J., Fikes, R.E.: Strips: A new approach to the application of theorem proving to problem solving. Artifical Intelligence 2(3-4) (1971) 189–208
- Gspandl, S.: KickOffTUG eine KI-Lehr- und Forschungsplattform. Master's thesis, Graz University of Technology, Graz, Austria (October 2007)
- Reip, M.: KickOffTUG Multiagentensystem der RoboCup Simulation League. Master's thesis, Graz University of Technology, Graz, Austria (October 2007)
- Gspandl, S., Monichi, D., Reip, M., Steinbauer, G., Wolfram, M., Zehentner, C.: KickOffTUG - Team Description Paper 2007. In: Proceedings of RoboCup 2007: Robot Soccer World Cup XI. (2007) beiliegend.
- Orderud, F.: Comparison of kalman filter estimation approaches for state space models with nonlinear measurements. Technical report, Sem Slands vei 7-9, NO-7491 Trondheim