RaiC10: Analyzing the Influence and Effectiveness of One-man Agent on its Team's Performance
Tomomi KAWARABAYASHI-KUBO, Tatsuya YAMADA
Fukui National Collage of Technology, Geshi Sabae City, Fukui Pref., 916-8507, JAPAN
http://sourceforge.jp/projects/rctools/
Abstract The purpose of our study is to examine the influence and effectiveness of one-man agent on its simulated soccer team based on the coordination, from the standpoint of its team's performance. The experimental results comparing teams TE9 and TE11 included the oneman agent with the team agent2d showed that the average scores of teams TE9 and TE11 were increased from 0.04 to 0.48 and from 0.04 to 0.50, respectively. Additionally, 67% and 96% of total scores of teams TE9 and TE11 are scored by the one-man agent, respectively.
1 Introduction
Our long-term objective is to realize an adaptive behavior selection between "behave by itself" and "behave cooperatively" on MAS and propose a design of MAS by using the one-man agent through a series of studies on the "oneman agent". The scientific focus of our team is to analyze the influence and effectiveness of the one-man agent on the team. The one-man agent is defined as an agent which behaves by itself without others' cooperation while the agent shares the team's goal.
Generally soccer agents are designed to make each agent collaborates with its team mates to accomplish the team's goal[1, 2]. However, getting back to completing the team's goal – to win against an opponent team –, it should not always be the best way that an agent behaves with the team mates cooperatively. It is also concerned that the agent which behaves by itself may produce good results. In fact, some of real human soccer teams are designed so that genuine talented player and his team mates can make the most of what he has. From these perspective, the one-man agent is focused on. The experiments were performed to examine the influence and effectiveness of the one-man agent on the team and improvement of the team performance. The agent2d-2.0.1[3] is used as a base code for all experimental teams. Then, the experimental results were analyzed from the standpoint of its team's performance including the number of wins and losses, scores and the number of shots. The result turned out that the team performance was improved when the one-man agent was in FW positions(See Section 3). Based on the experimental results and test games against several teams, the team RaiC10 consists of an one-man agent wearing uniform number 10 as FW and ten agents of agent2d-2.1.0 excepting the agent wearing uniform number 10. The one-man agent's base code is agent2d-2.1.0. The one-man agent and the experimental results are described as below.
2 One-man Agent
In our study, a one-man agent has been developed based on agent2d-2.0.1.
The one-man agent is defined as an agent which always takes the one-man approach and simultaneously shares the goal of its team – to win against an opponent team –. Then, the one-man approach is realized as the behavior that the agent dribbles the ball toward the opponent goal and then makes a shot without passing to its team mate.
Specifically, the one-man agent is implemented by removing "pass" from its behavior rules of the team agent2d.
3 Experimental Result
To examine the influence and effectiveness of the one-man agent in a simulated soccer team, experimentations were performed through simulated soccer games. Then, the experimental results of the teams including the one one-man agent were compared with the team's not including the one-man agent. The number of wins and losses, scores, the number of shots and trajectories of dribbling were used as analytical indicators.
3.1 Experiment Description
Simulated soccer games(eleven-on-eleven) were done as the experiments to 11 experimental teams below. Each experimental team played 50 times against the team agent2d. One game has 3000 simulation steps. An experimental team is a team that an agent in the team agent2d replaced by one one-man agent.
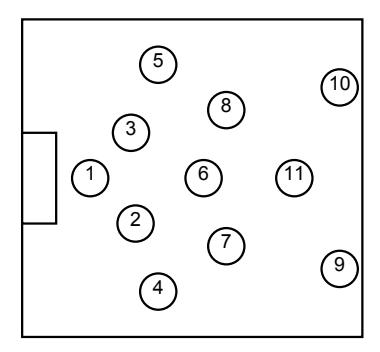
Fig. 1 shows the formation of the experimental teams. Each circle represents an agent. The digit in each circle is an uniform number of agent. The goal keeper wears uniform number 1.
The formation and agents' positions in the experimental teams are defined as follows.
$$T_{\rm Ei} = { p_j | 1 \le j \le 11 }$$
(1)
Where TE is an experimental team, i is a number of experimental team, p is an agent(player) and j is an uniform number of an agent. Also, the set of all experimental teams is described as follows.
$${T_{\rm Ei}|0 \le i \le 11, i \ne 1}$$
(2)
Where i is a team's identification number and is also the uniform number of the one-man agent of the team. There is no team TE1, because the goal keeper(uniform number 1) is not replaced by the one-man agent. When i = 0, TE0 is the same team as the team agent2d. The experimental results of team TE0 were utilized as the basis of analysis.
3.2 Experimental Results
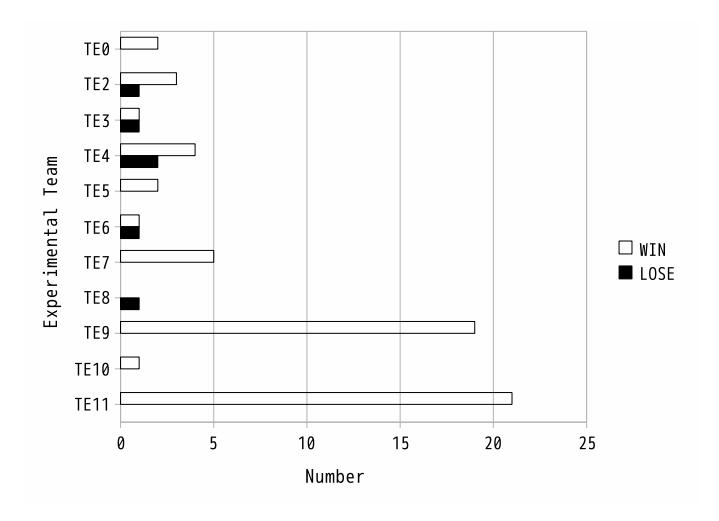
The bar chart in Fig. 2 shows the results of simulated soccer games per 50 games for each experimental team. Team TE9 had 19 wins, 0 loss and 31 draws and team TE11 had 21 wins, 0 loss and 20 draws. These teams won better than the others. Comparing teams TE9 and TE11 to team TE0 which has no one-man agent.The results have great advantage of the number of win games.
Fig. 2. Win-lose results of experimental teams against the team agent2d (50 games per an experimental team)
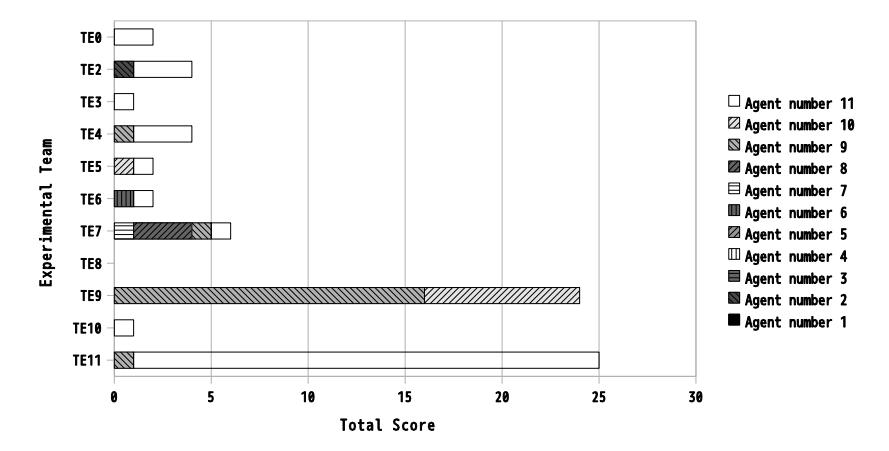
The bar chart in Fig. 3 shows the total scores of each experimental team and scores obtained by each agent. The graph legends show agents which score. Teams TE9 and TE11 score 24 and 25, respectively. It shows the great advantage of scoring from other teams.
Fig. 3. Total scores of experimental teams and agents against the team agent2d(50 games per an experimental team)
Table 1. Comparison of Experimental Results(Number of Shots and Scores) between teams TE0 and TE9
| Number of Shots | Scores | |||
|---|---|---|---|---|
| Avg. | SD | Avg. | SD | |
| TE0 | 0.08 | 0.27 | 0.04 | 0.20 |
| (0.04) | (0.20) | (0.00) (0.00) | ||
| TE9 | 1.02 | 1.02 | 0.48 | 0.68 |
| (0.40) | (0.61) | (0.32) (0.51) | ||
| t-value | 0.00 | 0.00 |
Values in parentheses are the results of the agent wearing uniform number 9.
Table 2. Comparison of Experimental Results(Number of Shots and Scores) between teams TE0 and TE11
| Number of Shots | Scores | |||
|---|---|---|---|---|
| Avg. | SD | Avg. | SD | |
| TE0 | 0.08 | 0.27 | 0.04 | 0.20 |
| (0.04) | (0.20) | (0.04) (0.20) | ||
| TE11 | 0.64 | 0.72 | 0.50 | 0.68 |
| (0.56) | (0.70) | (0.48) (0.68) | ||
| t-value | 0.00 | 0.00 |
Values in parentheses are the results of the agent wearing uniform number 11.
Table 1 and Table 2 show the results comparing Number of Shots and Scores of team TE9 and TE11 with them of team TE0, respectively. Teams TE9 and TE11 had average score of Number of Shots and Scores more than team TE0, respectively. The t-test results of team TE9 and TE11 based on team TE0 are significantly different, respectively. The one-man agents of teams TE9 and TE11 also had them more than agents in the same positions, respectively.
These results suggest that the one-man agents in teams TE9 and TE11 contribute to the improvement of the teams' performance, respectively.
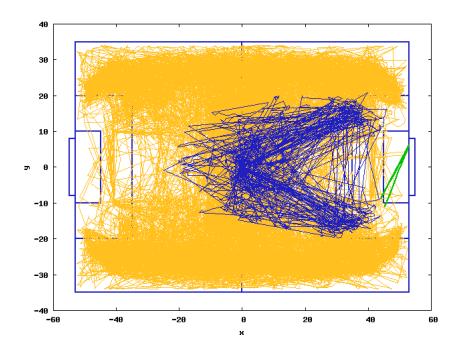
Fig. 4. Ball trajectory(team TE0 vs. the team agent2d, 50 games total). Light gray lines is the whole trajectory of the ball. Black lines is the dribbling trajectory by the agent wearing uniform number 9 of team TE0. Only dribbling play was extracted from the other behavior including a passing. Dark gray line is the shot trajectory by the agent wearing uniform number 9 of team TE0.
Fig. 5. Ball trajectory(team TE9 vs. the team agent2d, 50 games total). Light gray lines is the whole trajectory of the ball. Black lines is the dribbling trajectory by the agent wearing uniform number 9 of team TE9. Dark gray line is the shot trajectory by the agent wearing uniform number 9 of team TE9.
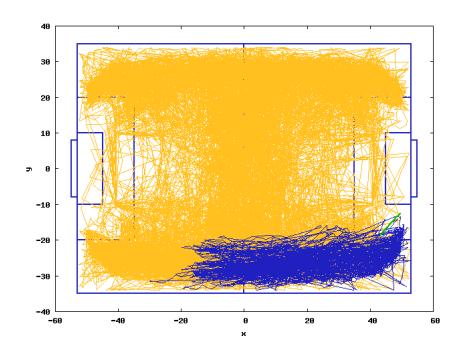
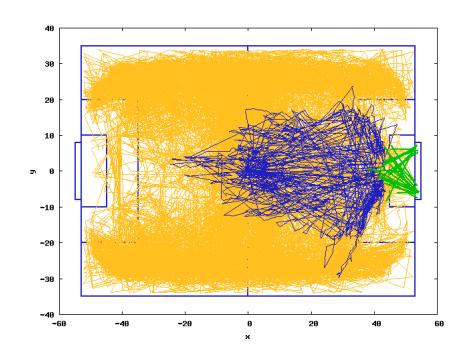
At the end, these teams' trajectories of the ball are shown in Fig.s 4, 5, 6 and 7.
Comparing team TE0 in Fig. 4 with team TE9 in Fig. 5, the whole trajectory of the ball(light gray lines) of team TE9 was changed clearly.
Also, comparing the dribbling trajectory(black lines in Fig. 5) of the one-man agent(the uniform number 9) of team TE9 with the trajectory(black line in Fig. 4) of the agent in the same position in team TE0(=agent2d), the trajectory of the one-man agent of team TE9 shows that the one-man agent headed to the opponent goal rather than the agent of team TE0. It leads that the team TE9's chances of shots(dark gray lines) increased rather than team TE0
The same tendency can been seen between the one-man agent of team TE11 in Fig. 7 and the agent(the uniform number 11) of team TE0.
Fig. 6. Ball trajectory(team TE0 vs. the team agent2d, 50 games total). Light gray lines is the whole trajectory of the ball. Black lines is the dribbling trajectory by the agent wearing uniform number 11 of team TE0. Only dribbling play was extracted from the other behavior including a passing. Dark gray line is the shot trajectory by the agent wearing uniform number 11 of team TE0.
Fig. 7. Ball trajectory(team TE11 vs. the team agent2d, 50 games total). Light gray lines is the whole trajectory of the ball. Black lines is the dribbling trajectory by the agent wearing uniform number 11 of team TE11. Dark gray line is the shot trajectory by the agent wearing uniform number 11 of team TE11.
Comparison of Experimental Results(Number of Shots and Scores) between teams TE0 and TE9
| Number of Shots | Scores | |||
|---|---|---|---|---|
| Avg. | SD | Avg. | SD | |
| TE0 | 0.08 | 0.27 | 0.04 | 0.20 |
| (0.04) | (0.20) | (0.00) (0.00) | ||
| TE9 | 1.02 | 1.02 | 0.48 | 0.68 |
| (0.40) | (0.61) | (0.32) (0.51) | ||
| t-value | 0.00 | 0.00 |
Values in parentheses are the results of the agent wearing uniform number 9.
Comparison of Experimental Results(Number of Shots and Scores) between teams TE0 and TE11
| Number of Shots | Scores | |||
|---|---|---|---|---|
| Avg. | SD | Avg. | SD | |
| TE0 | 0.08 | 0.27 | 0.04 | 0.20 |
| (0.04) | (0.20) | (0.04) (0.20) | ||
| TE11 | 0.64 | 0.72 | 0.50 | 0.68 |
| (0.56) | (0.70) | (0.48) (0.68) | ||
| t-value | 0.00 | 0.00 |
Values in parentheses are the results of the agent wearing uniform number 11.
4 Summary
The team RaiC10 consists of an one-man agent wearing uniform number 10 as FW and ten agents of agent2d-2.1.0 excepting the agent wearing uniform number 10. The one-man agent's base code is agent2d-2.1.0. The one-man agent was described and the experimental results indicated that the one-man agent is effective when it was in FW positions.
References
- M. T. J. Spaan, N. Vlassis, and F. C. A. Groen. High level coordination of agents based on multiagent markov decision processes with roles. In Proceedings of the International Conference on Intelligent Robots and Systems (IROS), pages 66–73, 2002.
- P. Stone and D. McAllester. An architecture for action selection in robotic soccer. In E. Andre, S. Sen, C. Frasson, and J. P. Müller, editors, Proceedings of the Fifth International Conference on Autonomous Agents, pages 316–323, New York, NY, 2001. ACM Press.
- agent2d source: http://sourceforge.jp/projects/rctools/