RoboCup 2015 - 2D Soccer Simulation League Team Description Ri-one (Japan)
Syuto Bando, Yuki Tada, Kosei Yamaguchi, Takuro Shibayama, Yuki Katsumata, Kota Asai, Koichi Uchinishi, Hiroki Nomura, Hayato Tanaka, Ryo Kondo, Shiori Kubo, Yuri Tani, Makoto Sei, Chisa Takemura, Yumi Mori
Ritsumeikan University, Japan
Abstract In this paper, we will outline methods which we have incorporated in preparation for RoboCup 2D Soccer Simulation 2015. Our team last year adopted an evaluation function which determined the direction of a pass or dribble of the ball. This year we have worked on making a significant improvement to this existing evaluation function, allowing agents to make moves which are less likely to be obstructed by agents in the opposing team. By comparing winning percentages, the difference in the number of goals scored, and the possession rate of the ball, we have implemented many new algorithms in order to improve this evaluation function.
Introduction
Ri-one is a project team which belongs to the Information Science and Engineering department at Ritsumeikan University. The organization has participated in the 2D Soccer Simulation League and Rescue Simulation League in previous years. Our members had been working with UVA-Trilean base [1] until 2013. However since May 2014, we started working with agent 2D base (release 3.1.1) made by H. Akiyama [2]. In RoboCup 2006 in Bremen, our team finished in third place. In RoboCup Japan Open, we came third place in 2009 and then went on to win the championship in 2012. This paper will include the following sections:
- Introduction : We will introduce our team and show the outline of this paper
- Examining methods : We will make a suggestion about four new methods
- The Genetic Algorithm :We will introduce the genetic algorithm.
- The Estimated Pass Way : We will introduce the estimated pass way.
- The Three Choice Routes Method : We will introduce the three hoice routes method.
- Experiments : We will explain experiments carried out
- Results
- Evaluation and Conclusion : We will summarize our ideas and describe future directions
- References
Examining methods
In order to determine where we could make improvements with the creation of our new team for this year's league, many matches were carried out with the following teams: HE-LIOS BASE, agent2D base, KU BOST, Fifty-Storms and AUT-Parsian. From these matches many sets of data were analysed and, as a result, it was noted that our agents often choose an area with many obstructing opponents when deterniming a path to pass the ball or the direction of a dribble. It was thought that the reason for this was because the evaluation function value which decides movement when our agents hold a ball, was not calculated appropriately for the situation. By improving this function, our agents will be able to determine the opponents' course of action with better accuracy. In addition, if we can predict the action of our opposing team, it increases the chances for a member of our team to be in possession of the ball, and therefore the possibility of scoring a goal. As a result of this, we simultaneously reduce opportunities for the opposition to score a goal, consequently reducing the number of points which we lose to them. From the analyses above, we deduced that in order to build a stronger team, we need to change the evaluation function in a way which will allow our team to score more points and to have more possession over the ball. Baring this in mind, we decided to improve what seemed to be our 'weak point' as previously stated above, that " the evaluation function value is not appropriate " for the current team. We looked into the reasons which were causing the value of the evaluation function to be inappropriate in its current state, and found two major problems in the function which we were using at the time:
- Our team is based on a static implementation.
- The movement of the enemy is not taken into consideration.
In order to solve these problems mentioned above, we suggested the following techniques:
- The Genetic Algorithm
- The Estimated Pass Way
- The Three Choice Routes Method
The Genetic Algorithm
In 2008, Ri-one wrote a method which incorporated the gravity field together with 'magic numbers' which were assigned to set variables based on educated assumptions. This method however, was not sufficient to evaluate an accurate evaluation value. In order to resolve this problem, we suggest to approximate these values with refined accurary by introducing the genetic algorithm.
Methodology
Using the genetic algorithm, we defined weights of goals, opponents, and our agents as candidates of having a magic number allocated to them. Once these magic numbers have been given, they are then evaluated together with the evaluation value of the game itself, and the two largest of these final evaluation values are left as so-called 'elites'. Other non-elite members are made parents which then create the next generation. During this operation, we purposefully generate a one percent mutation in the next generation, which prevents the evaluated magic number to become a localized solution. After running 20 games with the base team, we made calculations by subtracting the number of points scored by the opposing team from the number of goals made by each of our agents. By using these numbers as a domain to the evaluation function, we computed evaluation values which would leave the 'elites' in for the next game. As a result of this method, individuals which performed well in the game were more likely to remain, leaving better values behind.
The Genetic Algorithm: building the 'magic number'
In order to carry out experiments on our team using the genetic algorithm, we first need to compute the improved magic numbers. We tested 10 individuals, on how their genetically inherited values changed as they were passed down through generations. Initial values which were set to each of the variables are sgown in Table 1. These were then used ot calculate the new magic numbers. Once this process had been carried out, we compared the initial values with the new magic numbers obtained through calculations which we hypothesized would improve our team. For the purpose of this experiment, data was taken from the games played against HELIOS BASE.
Table 1. Initial values.
| Individual number | 1 | 2 | 3 | 4 | 5 | 6 | 7 | 8 | 9 | 10 |
|---|---|---|---|---|---|---|---|---|---|---|
| opponent agent | 18 | 17 | 13 | 14 | 10 | 16 | 11 | 12 | 15 | 19 |
| our agent | 14 | 13 | 10 | 12 | 18 | 15 | 19 | 16 | 17 | 11 |
| opponent goal | 130 | 110 | 160 | 150 | 140 | 100 | 170 | 190 | 180 | 120 |
| our goal | 190 | 120 | 140 | 180 | 130 | 110 | 160 | 170 | 150 | 100 |
| evaluatoin value | -4 | -1 | -1 | -6 | 1 | -3 | -2 | -3 | -4 | 0 |
These experiments were carried out on 10 consecutive generations. After repeating the process 10 times, our last generation showed inherited results as shown in Table 2.
Table 2. Values of magic numbers for the 10th generation.
| Individual number | 1 | 2 | 3 | 4 | 5 | 6 | 7 | 8 | 9 | 10 |
|---|---|---|---|---|---|---|---|---|---|---|
| opponent agent | 13.42 | 13.43 | 13.43 | 13.42 | 13.42 | 13.44 | 13.43 | 13.43 | 13.44 | 13.42 |
| our agent | 15.38 | 15.34 | 15.37 | 15.39 | 15.38 | 15.37 | 15.35 | 15.34 | 15.36 | 15.33 |
| opponent goal | 143.97 | 144.33 | 143.78 | 143.89 | 143.79 | 143.72 | 144.42 | 144.52 | 143.88 | 144.62 |
| our goal | 142.70 | 142.97 | 142.56 | 142.67 | 142.63 | 142.61 | 142.98 | 143.07 | 142.72 | 143.09 |
| evaluation value | 15.75 | 19 | 17.5 | 17.35 | 13.85 | 17 | 18 | 10.75 | 13.375 | 26 |
The Estimated Pass Way
This method estimates the positions of opposing agents in advance, and reflects these presumptions to the current game. From past logs, we establish the traces of routes which opponents have previously moved though, and lower the priority of those areas when determining a route to pass the ball. By using this method we hoped to capture more precisely, the position in which an opponent agent may be. For the purpose of this experiment which we propose, we will consider four defenders from an opposing team.
Methodology
First, we demand the traces of the relevant opponents. In order to do this, we divided the the field into 36 cells of 1x1 along the x-axis. The reason for choosing 0 36 as the range, is because this exactly covers the area from the centerline to the penalty area. When an opponent agent exists in any of the divided cells, the position coordinate of this agent applies a number calculated by a programmed equation, to the cell which it is currently standing on representing that it has been there. Every time the agent moves over any of the cells (whether it be a new cell or one which it has previously passed through), a number is given to that point, creating a sequence. By doing this, we pinpoint the most frequent positions of the moving agents, of which a visual representation is shown in the graph below Fig 1. Opponents are more likely to exist in the cell of the darker color.
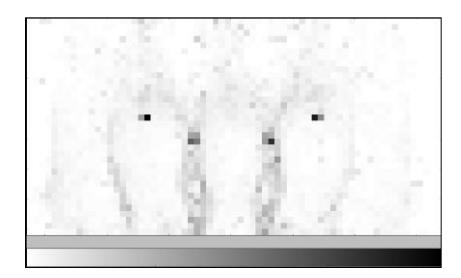
Having evaluated these traces, we can now read in this data before a game starts so that the information can be applied to the next game. When an agent on our team approaches one of these highlighted areas with a ball, they will operate according to an equation which states that the closer the distance to one of these concentrated points, the more likely it is that the agent will not make a pass in that direction. By this procedure, our agents have a higher probability of making a pass in a direction which is not obstructed by any opponents, thus increasing the chances of scoring a goal.
The Three Choice Routes Method
This procedure makes use of the same area of the field as was used in the Estimated Pass Way method from above. Within this area, agents are given three routes to choose from when making a pass. The reason for suggesting this method is to reduce the possibility of having a ball stolen by an opposing agent while an agent on our team in possession of the ball is making a choice from countless paths. The idea is that the time taken for our agent to think, will be reduced by allocating pass coureses beforehand. Three seemed to be the most appropriate number when speculating a good medium between keeping the possible range of paths wide enough, and narrowing the thought process for the agent.
Methodology
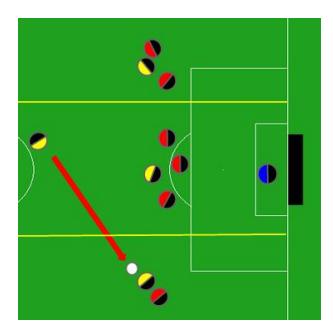
In this technique, pass routes from the kicker to agents in the field, are computed using the following algorithm. First, we divide the opposition's half of the field into 3 horizontal sections and determine three possible routes. Our agent then makes a decision for one of these routes, by calculating the priority level of each range according to the number of opposing agents in each section. We show the example in Fig 2. Using this method, the rate of making a successful pass should increase.
Experiment
Having computed the more accurate magic numbers, we proceeded to carry out 300 matches against 4 teams in order to collect sufficient data. These teams were HELIOS BASE, KU-BUST, AUT-Parsian and Fifty-Storms. The matches were played with our new team which made use of a Field Evaluator in which all the new methods mentioned throughout this paper were implemented. For each of the four methods, we conducted an analysis of the log data and compared the number of goals scored, the number of points lost to the opposition, the possession rate of the ball, and the overall probability of winning the game.
Results
The initial values obtained through the evaluation function before the implementation of these new methods are shown in Table 3 below. Data after applying the new methods are the genetic algorithm Table 4, the Estimated Pass Way method Table 5, and the Three Choice Routes method Table 6, as shown below in the respective order. From these data we draw attention to the following observations. Using the implementation of the Estimated Pass Way method, the control rate of our team rises, and in addition the rate of points scored by the opposition shows a decrease. The Three Choice Routes method, did not in fact show a lot of difference in comparison to what the values were before.
Table 3. Team before implementation.
| vs Team name | win rate | goal average | loss average | control rate |
|---|---|---|---|---|
| HELIOS base | 88.55% | 3.45 | 1.01 | 54.42% |
| KU-BUST | 69.50% | 3.34 | 1.91 | 55.04% |
| AUT-Parsian | 76.55% | 3.09 | 1.64 | 62.52% |
| Fifty-Storms | 77.33% | 3.18 | 1.82 | 40.12% |
Table 4. Results obtained with the genetic algorithm.
| vs Team name | win rate | goal average | loss average | control rate |
|---|---|---|---|---|
| HELIOS base | 74.25% | 2.693 | 1.326 | 53.78% |
| KU-BUST | 57.71% | 1.435 | 1.966 | 34.38% |
| AUT-Parsian | 63.74% | 1.527 | 1.427 | 50.33% |
| Fifty-Storms | 41.97% | 3.275 | 2.583 | 58.26% |
Table 5. Results obtained with the Estimated Pass Way method.
| vs Team name | win rate | goal average | loss average | controle rate |
|---|---|---|---|---|
| HELIOS base | 79.00% | 2.325 | 1 | 62.5 |
| KU-BUST | 60.26% | 2.311 | 1.748 | 61.75% |
| AUT-Parsian | 66.33% | 2.326 | 1.48 | 67.50% |
| Fifty-Storms | 80.67% | 3.16 | 1.59 | 45.06% |
Table 6. Results obtained with the Three Choice Routes method.
| vs Team name | win rate | goal average | loss average | controle rate |
|---|---|---|---|---|
| HELIOS base | 85.71% | 2.844 | 1.03 | 59.66% |
| KU-BUST | 77.00% | 3.92 | 1.99 | 55.35% |
| AUT-Parsian | 75.00% | 2.956 | 1.596 | 62.60% |
| Fifty-Storms | 83.67% | 3.25 | 1.57 | 45.13% |
Evaluation and Conclusion
With the data from the experiments, we have made observations concerning each of the methods. Evaluating the results obtained after implementing the genetic algorithm, it is hard to say that we have seen any significant improvement. It is thought that the reason for this is due to the manner in which we chose the so-called elite members, and the evaluation values which were assigned to them. In our implementation this year, we chose the two best individuals to stay in the game as part of the next generation. However after playing 20 games, the difference between the computed values became more and more similar particularly in generations lower down, giving results which did not differ from each other in any significant way. This can be seen from the evaluation values in Table 2 in section 3, which show that 40 of the individuals sit at around 17. In theory, it would have been better to use a roulette method to choose elite members. However given that evaluation values which are the domain to the genetic algorithm function are calculated by differences in scores, there is a possibility that nagative values may appear, causing problems for a roulette method. The Estimated Pass Way method gave more promising results which we hoped to see, as portrayed by the rise in the amount of control our agents had over the ball, and also the number of goals which we prevented from the opposition. Unfortunately however, this did not lead to an increase in the number of wins. An explainable reason for this is that our team played the game too safe, only making passes to areas which were likely not to be obstructed. This resulted in our agents not making it to the opposition's goal area very often, thus decreasing the number of goals which we could have made. Results after implementing the Three Choice Routes method did not in fact show a lot of difference in comparison to what the values were before. This was not as we expected, however this method did show a rise in the overall winning rate. Having compared the methods mentioned above, it seems that although EPS shows improvement in specific variables, three choice routes method is in fact a better implementation which pushes our agents to score more points, leading to more wins. In the future, we will be looking into giving different values to agents standing near the goal, and also to program new movements for agents on our team in order to improve these implementations further.
References
- UVATrilearn. http://sta.science.uva.nl/jellekok/robocup/.
- Hidehisa Akiyama, Tomoharu Nakashima: HELIOS Base: An Open Source Package for the RoboCup Soccer 2D Simulation, Proc. of 2013 RoboCup Symposium, 8 pages (2014)