HELIOS2016: Team Description Paper
Hidehisa Akiyama, Tomoharu Nakashima, Jordan Henrio, Thomas Henn, Sho Tanaka, Tomonari Nakade, Takuya Fukushima
Fukuoka University, Fukuoka, Japan; Osaka Prefecture University, Osaka, Japan
Abstract The introduction of Team HELIOS2016 is given in this Team Description Paper (TDP). First, a brief background of the team is given. Then the latest development of the team is described. The team has developed a model which decides the strategy that should be applied regarding a particular opponent team. This task can be realized by applying preliminarily a learning phase where the model determines the most effective strategies against clusters of opponent teams. The model determines the best strategies by using sequential Bayes' estimators. We determined associations of player distributions against opponent teams in the particular situation of corner-kick. The performance of the model is shown effective by a series of computational experiments given in this TDP.
Keywords: RoboCup · Bayes' estimation · Earth Mover's Distance · hierarchical clustering
Introduction
HELIOS2016 is a simulated soccer team for the RoboCup soccer 2D simulation league. The team has been participating in the RoboCup competition since 2000, and has won two championships [2].
We recently focus on the game analysis using a clustering method and applying the best strategies against clusters of opponent teams. In this paper, we introduce our approach for selecting the strategies using Bayes' Estimation.
Selecting the Best Player Distribution based on Bayes' Estimation
The essential part of the work in the 2D soccer simulation league is to design an effective strategy or method that outperforms opponent teams. Player distribution is one of the most important aspects in the strategy design as it gives the guidelines of the decision making during the game. The player distributions are generally designed according to a given opponent team. However, it is not necessary to create a specialized player distribution against each opponent as it is possible that some of them are similar regarding particular features. By using this fact, it is possible to cluster similar opponents together and then look for the most effective strategy against this group.
We proposes a model which groups similar opponent teams together during a learning stage and then associates one already existing player distribution to each cluster by performing sequential Bayes' estimations. As a first trial, we focused on the special case of selecting the best player distribution for cornerkick situations.
fedit2 and configuration files
Conventionally, to design player distributions we use a graphical tool named fedit2 [1]. It is a software which allows the user to assign locations to players according to particular positions of the ball on the field. The mapping from a certain ball position into players' positions is compiled in a configuration file, which is produced by Fedit2.
During a game the soccer team uses these configuration files to assign target positions to the agents. The actual position of each player will vary around its target position, within a range, depending on the state of the environment.
Opponents Clustering
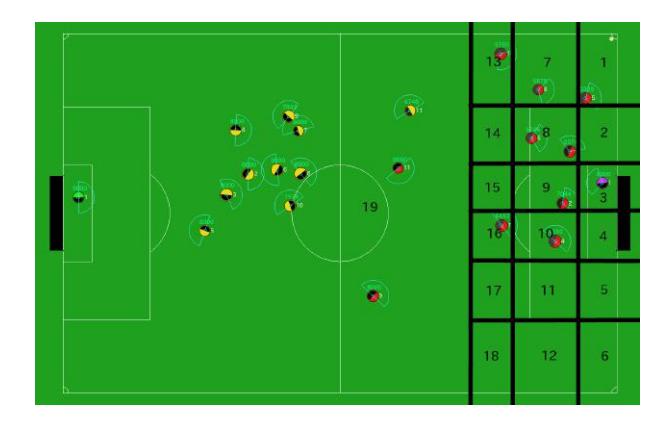
Team distributions. First of all, in order to group opponent teams for clustering analysis, it is necessary to build distributions representing them. We suggested to build distributions representing the location of the opponents over the corner-kick area. Thus, we designed a cutting of this part of the field as shown in Fig. 1. This partition is totally arbitrary, but shows how opponent players are spread in this area during their defense situations. Resulting distributions represent the field divided into 19 blocks, where each block is associated with the number of opponent players in it. For example, Fig. 1 shows us nine opponents (red and purple players) in their defense area. By analyzing this defense player distribution, the resulting distribution would be written as the following 19-dimensional integer vector:
[1, 0, 1, 0, 0, 0, 1, 2, 1, 1, 0, 0, 1, 0, 0, 1, 0, 0, 2].
Clustering process. Once all opponents' distributions are determined, we analyze the degree of similarity between each possible pair in order to generate a distance matrix. The distances between distributions are computed by using the Earth Mover's Distance (EMD) [3] method. EMD provides a pseudo metric measure between two probability distributions. It can handle a vector with different dimensionalities and weighted features. The measurement process is expressed as a transportation problem where one distribution is the supplier and the other the customer.
Then, it is possible to apply hierarchical clustering on this matrix to find groups of similar opponent teams. This process merges the pairs with the smallest distance together until to obtain a unique cluster containing every element of the data set.
Strategy Selection
Performance evaluation of player distributions. In order to select the most effective strategy, we need to evaluate player positioning performance with respect to a success metric. For example, the probability of success of an attack following a corner-kick, can be used as a performance metric. However, the RoboCup 2D soccer simulation league introduces randomness in the way the players interact with the environment. Each player receives imperfect and noisy input of his virtual sensors. As a result, two soccer games with two exactly the same teams can differ significantly. Therefore, evaluating player positioning performance is a challenging task. There is a lot of variance when trying to estimate a success metric. Moreover, there is not necessarily large effect differences between player distributions. Thus, it is necessary to run a large number of soccer games in order to estimate one player distribution's performance with enough precision.
In order to sort each player distribution with respect to the others, we consider the difference in means between the samples of each player distribution's simulation.
Sequential Bayes' estimation. Bayes' theorem is stated as in (1).
$$p(\theta|D) = \frac{p(D|\theta)P(\theta)}{p(D)}$$
where $p(\theta|D)$ is called a posterior, $p(D|\theta)$ is a likelihood, $p(\theta)$ a prior and $p(D)$ is an evidence which stands as a normalizing constant. $\theta$ represents the value of the parameter we are trying to estimate, in our case that is the probability of the success of an attack following a corner-kick. $D$ corresponds to the new data we have accumulated at the moment of applying the theorem. The purpose of the Bayes' theorem is to update a prior belief $p(\theta)$ we have about the value of $\theta$ using new data $D$. The posterior distribution $p(\theta|D)$ will then correspond to our updated belief in the different possible values of $\theta$.
It is possible to sequentially update the parameters by computing Bayes' theorem each time one or more simulations are over by using the previous posterior as the prior for the next computation of the Bayes' theorem.
Player distributions comparisons. In order to determine from each difference distribution, whether one player distribution is better than another or whether we need to run more simulations to be sure, we begin by computing the Highest Density Interval (HDI) [4] which is an interval spanning 95% of the distribution such that every point inside the interval has a higher probability than any point outside the interval. To do so, we consider the probability of success of Distribution 1 and Distribution 2, defined as $p^1$ and $p^2$, respectively. Then, by calculating all of the possible values of $p^1 - p^2$, we can obtain the corresponding distribution. Finally, by observing the HDI of the resulting distribution the system can conclude about which player distribution is better than the other.
Experiments
Opponents clustering. For our experiments, we involved 12 teams participating in JapanOpen competitions, as well as two versions of agent2d which does not participate in any competitions, but are used by most of the participants as the starting point of team development. Actually, three clusters were determined. The second cluster is the most populated among the three ones because it represents the teams using a player distribution similar (if not the same) to that of agent2d, which is probably their implementation starting point. On the other hand, the third cluster included only one single team that is too far to be merged with any other cluster.
Association learning. In order to experiment the abilities of our learner, we used three corner-kick formations that were already implemented in our team. We start from a beta distribution with parameters 2 and 2 (i.e., Beta(2, 2)) to represent our prior beliefs for each player distribution. Such a distribution expresses a strong belief around 50%, but our beliefs decrease as much as we move toward the extremes (i.e. null or perfect success rates). Generally, 37 corner-kicks are executed during one simulation, but this number can vary from one run to another. Before performance comparisons, we performed 60 simulations for each player distribution.
The results of our experiment are summarized in Table 1. It shows the final associated player distribution for each cluster. Also, it indicates the HDI of the selected player distribution. Finally, it gives the superiority factor of the selected player distribution compared to the second best player distribution, regarding the average probability.
Results Summary of the Learning Association Experiment.
| Cluster | Selected Distribution | HDI | Superiority Factor (in means) |
|---|---|---|---|
| 1 | 2 | [0.203, 0.237] | 1.787 |
| 2 | 3 | [0.531, 0.571] | 2.073 |
| 3 | 1 | [0.471, 0.512] | 2.179 |
Conclusion
We have developed a system that is able to select the best player distribution in corner-kick situations regarding a group of teams. This decision is taken by doing sequential Bayes' estimations from the results of several games. The model does not create effective player distributions, but instead indicates us the best that we have already in hand.
Several experiments were conducted by varying the number of simulations before distribution comparisons. The more simulations are performed, the more centered on their true probability with a small variance the distributions tend. Also, further experiments shown that we can rank perfectly pairs of player distributions with at least 5% of difference by proceeding only 20 simulations. Furthermore, it is possible to increase the precision of the system by getting more data. However, if you do this way you would increase the learning time considerably.
On the other hand, we have observed that there is a possibility of disparities inside the clusters. Thus, the selected strategy could not be appropriate against all team of a cluster because our classification method does only take into account the position of opponent players and not their skills.
Finally, while our first trials selected player distributions for corner-kicks only it is possible to use it for any situation of the game. The only conditions are to have a criterion for opponents clustering and a success metric for data observations.
References
- Hidehisa Akiyama and Tomoharu Nakashima. Helios base: An open source package for the robocup soccer 2D simulation. Proc. of RoboCup Symposium 2013, Total 8 pages, 2013
- Hidehisa Akiyama and Tomoharu Nakashima. HELIOS2012: RoboCup 2012 Soccer Simulation 2D League Champion RoboCup-2012: Robot Soccer World Cup XVI, Springer Verlag, 2013
- Rubner Yossi, Tomasi Carlo, and J. Guibas Leonidas. The earth mover's distance as a metric for image retrieval, volume 40. International Journal of Computer Vision, pages 99–121, November 2000.
- John K. Kruschke. Doing Bayesian Data Analysis a Tutorial Introduction with R and BUGS. Academic Press / Elsevier, 2010.