HfutEngine2019: Team Description Paper
Gaofei Mei, Hao Bian, Jian Zhang, ZhanCai Dong, Hao Wang, BaoFu Fang
Robotics and Intelligent Technology Lab School of Computer and Information HeiFei University of Technology, P.R.China
http://robot.hfut.edu.cn/shiyanshi/
Abstract This team description paper mainly explains the work of HfutEngine2D at this stage.We used the logistic regression to optimize the behavior of tackle, and improved the action chain with Monte Carlo tree search (MCTS). The evaluator of action chain performance has improved. According to the feature of our team, we have made the corresponding strategy design. Tested with various strong teams, the current version of HfutEngine2D has promoted in both attack and defence ability.
1 Introduction
HfutEngine2D was founded in 2002 and participated in China Robot Contest the same year. In the following years, HfutEngine develops rapidly and participates in various competitions. Since 2003, we used the UVA BASE2003 as our underlying code, along with the server version of the update in intercepting the ball on the learning, BP neural network algorithm is adopted, in terms of choice of action adaptive, learning algorithm based on value is adopted, in passing action learning opportunities perspective-taking reinforcement learning algorithm and a series of machine learning algorithm are also adopted, achieving good effect.Since 2014 we use Agent2D as our underlying code for HfutEngine2D construction.We have taken part in Robocup China open from 2002 to 2018 and won the 2007 Robocup China open runner-up.We have also taken part in the World Cup from 2008 to 2018 except 2012 and 2018,and we won seventh place in 2008 and eighth place in 2015.From 2008 to 2010,we have taken part in Robocup Iran open and won the bronze in 2008 ,the champion in2009.
2 Optimizing tackle using logistic regression
In the simulation 2D competitions, tackle is an important strategy. A successful tackle can prevent the opponent's attack and even help us get the ball,while a failed tackle will bring the player into a frozen state (10 cycles in place), causing great danger.
The player agent calculates the T and F values based on factors such as body angle and speed. T represents the probability of the tackle, and F represents the probability of foul, ranging from 0 to 1.
The values of T and F can be acquired through the existing function interface. We want to improve the defense ability by reasonably judging T and F, reducing the number of tackle failures and retaining effective tackles.
Input and Output
This experiment is a binary classification task. The values of T and F acquired when the side back agent execute the tackle action are used as input vectors. The label is setted to 1 if the tackle is successful and 0 when failed.
Data collection
We extracted the data of 100 games from the rcg file and used them as the training data after preprocessing.
Classification algorithms
We compared logistic regression, single-layer decision trees, AdaBoost, etc., and finally adopted the logistic regression using Newton method.
Experiments and analysis
Consider the application of the classifier in the team and compare the above classifiers. The AdaBoost method using 25 weak classifiers is slightly better than the logistic regression in the training set, with no major differences. According to the Occam's razor,we use the simple one. So the logistic regression with the basis function 0 1 1 2 2 w w x w x + + = sin( ) 0 is adopted,using the Newton method for training.Set the learning rate to α = 0.03, and finally get the linear classifier.
Table 1. The error rate of the classifiers on the dataset
| Data set | Logistic Regression | Decision tree | AdaBoost |
|---|---|---|---|
| Training set | 20.83% | 34.32% | 21.35% |
| Testing set | 21.94% | 37.28% | 21.86% |
The tackle part is in the file bhv_basic_tackle.cpp. According to the obtained linear classifier, it is improved on the basis of the original strategy. The original strategy was obtained after many experiments, which is very informative and cannot be completely negated, so heuristic ideas are used. First, according to the original strategy, if the tackle condition is not satisfied, the tackle will not be executed. For the case where the original strategy is judged to be able to tackle, the classifier is used for judgment. If the classifier predicts that the tackle will succeed, then execute this behavior ; if the classifier predicts that it will fail, then the angle relationship is additionally compared. The first angle is the player's body angle and the second angle is the angle between the player and the ball. The smaller the difference between their values is, the more the ball is in front of the player. We set the threshold to 15 degrees, and if it is greater than 15 degrees, the tackle will not be executed, otherwise it will be executed.
Table 2. Comparison of the failure rate of the tackle
| Optimization | Number of failures | Total | Failure rate |
|---|---|---|---|
| Before | 28 | 379 | 7.39% |
| After | 23 | 392 | 5.87% |
We counted the number of successful tackles and failures of side back agent 4 in 50 games. It was found that the total number of tackles did not change much after the new strategy was used, but the tackle failure rate dropped from 7.39% to 5.87%. It shows that the tackle ability has not decreased, but the probability of failures is reduced.
3 Improve the action chain with Monte Carlo tree search
The tree search algorithm is applied to the selection of the action sequence. We think that the effect of some other tree search algorithms may be better than the Best-first search.
There is a tree search algorithm called Monte Carlo tree search. In this paper, we used a variant of MCTS called UCT and accomplished several sets of comparative experiments. Each round of Monte Carlo tree search consists of four steps: Selection, Expansion, Simulation and Back-propagation. In the algorithm, we choose the following formula to calculate and update the weight of each node:
$$\bar{x}_i \pm \sqrt{\frac{\ln n}{n_i}}$$
In this formula:
̅ stands for the average score
stands for the number of visits to the i-th node
n stands for the total number of visits to all nodes
Experiments
We replaced the original algorithm Best-first search with the UCT, and the maximum search depth of the tree was set to 4. A certain effect has been achieved with the Intel Core I7-8750 processor.
Table 3. The team winning rate of using two different algorithms
| Opponents | Best-first search | MCTS |
|---|---|---|
| MT | 31.00% | 37.00% |
| YuShan | 76.50% | 79.93% |
| Alice | 80.04% | 82.25% |
| Cyrus | 33.41% | 35.02% |
| Oxsy | 43.70% | 44.39% |
4 Evaluator
For a team, The action evaluator scores the action and directly defines the value of an action, so the quality of the evaluator has an important impact on the strength of a team. We did a lot of optimization for the evaluator.
Problem Description
For a team, The action evaluator scores the action and directly defines the value of an action, so the quality of the evaluator has an important impact on the strength of a team. We did a lot of optimization for the evaluator.
Evaluator structure
The code of evaluator consists of three main parts:
- 1)The evaluation of special circumstances.
- 2)Basic evaluation.
- 3)Additional evaluation.
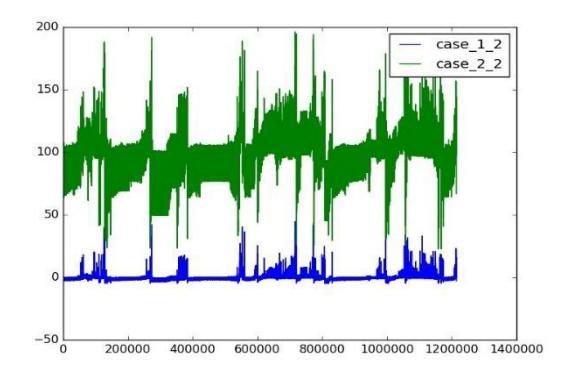
Table 4. Average number of goals
| Opponents | Option 1 | Option 2 |
|---|---|---|
| MT | 1.61 | 2.82 |
| YuShan | 2.90 | 3.44 |
| Alice | 3.19 | 3.78 |
| Cyrus | 0.67 | 1.02 |
| Oxsy | 1.57 | 1.74 |
For the basic evaluation, we have designed two options.
Option 1: We first assign an initial score to this action, the value is equal to the x coordinate of the ball divided by the value of 10. Then add points according to the distance of the ball from the opponent's goal.
Option 2: We also assign an initial value to the action, the value is equal to the x coordinate of the ball plus the length of the course. Then add or subtract points according to the distance of the ball from the opponents' goal.
We visually analyze the difference between the two options in the form of a chart.
As can be seen from Figure 1, the magnitude of the change in the value of the option 2 is quite large. In option 2, the closer the ball is to our goal, the lower the score, and this is not reflected in option 1. Option 2 is more sensitive to location information.
As Table 4 shows that option 2 makes our average number of goals increase.
5 Conclusion
This paper described the research's focus and the current effort of HfutEngine2019. We used the logistic regression to optimize the behavior of tackle, and improved the action chain with Monte Carlo tree search (MCTS). The evaluator of action chain performance has improved. After improvement, HfutEngine2D is more aggressive.
In the future, we will continue to try more methods, and through the log file for detailed analysis, to explore more effective ways to strengthen the offensive module.
References
[1] Baofu Fang. Robot Soccer Simulation[M]. Hefei University of Technology Press, 2011. [2] Hang Li. Statistical Learning Algorithm[M]. Tsinghua University Press, 2012. [3] Zhihua Zhou. Machine Learning[M]. Tsinghua University Press, 2016. [4] Yu Zhou, Hong Gu. Partial Label Learning Algorithm for Imbalanced Data Based on Logistic Regression[N]. Journal of Dalian University of Technology. [5] JorgeNocedal, StephenJ.Wright. Numerical Optimization[M]. Springer New York, 2006. [6] Nagae N, Igarashi H, Ishihara S. Return Pass in RoboCup 2D Simulation League: State Prediction and Evaluation Function of the Chain Action[C]. Proceedings of the Fuzzy System Symposium. 2015. [7] Defu Long. Log Mining and Application in RoboCup 2D Simulation[D]. Guangdong University of Technology, 2016.