MT2021: Team Description Paper
Linsheng Guan, Qiuna Chen, Zengcheng Shi, Wenlong Lv, Shengbing Chen
College of Artificial Intelligence and Big Data, Hefei University, Anhui Province, P.R.China, 230601
http://www.robocup.org/ · http://en.sourceforge.jp/projects/rctools/ · http://www.rctools.sourceforge.jp
Abstract MT2021 is a team of 2D soccer simulation league which is consisted of the students who are coming from Hefei University and all of them are with strong robot enthusiasm. Since 2012, the MT2021 team has participated in RoboCup China open tournament, since 2015, our team has participated in RoboCup World Cup every year and has achieved many good results. This paper briefly describes the background of MT2021 and the main works of our team since the 2019 RoboCup World Cup. Through these works we have greatly improved the competive ability of our team.
Introduction
MT2021 comes from Hefei University, China, and has actively participated in various RoboCup competitions, including China Open, Iran Open and Portugal Open. Since 2015, our team has performed well in the Robot World Cup, entering the final eight of the 2D simulation group for five consecutive sessions, and has been recognized by many powerful teams and friends in the world. Our major achievements in recent years include: Champion in the 2016 Portugal Open, 3rd Place in the 2018 Robocup2D World Cup, 5th Place in the 2019 Robocup2D World Cup, etc. Through extensive training, testing, and log data mining, we found some deficiencies in the team and optimized the team code in many ways. We hope that the improved code will work well in this year's competition and improve the level of team play.
We hope to present our latest research results and team technology in Robocup2dworldcup competition in 2021, achieve better results, and be able to actively discuss, learn and communicate with other teams through the competition.
MT2021 Description of the underlying
We use the underlying version is agent2d - 3.1.1, download address is: http://en.sourceforge.jp/projects/rctools/. The underlying way to use the chain of actions, using librcsc as the underlying library. We modified and optimized MT2021 on the basis of MT2020.
Python-based game log data mining
The rcg and rcl log files generated by the team during the game record the position, speed and player positions of the ball during each period of the game. In order to better analyze the offensive and defensive characteristics of ourselves and other teams, we used Python to write scripts to mine the information we needed from the log files, which was convenient for data analysis and targeted optimization of team code.
Pass analysis
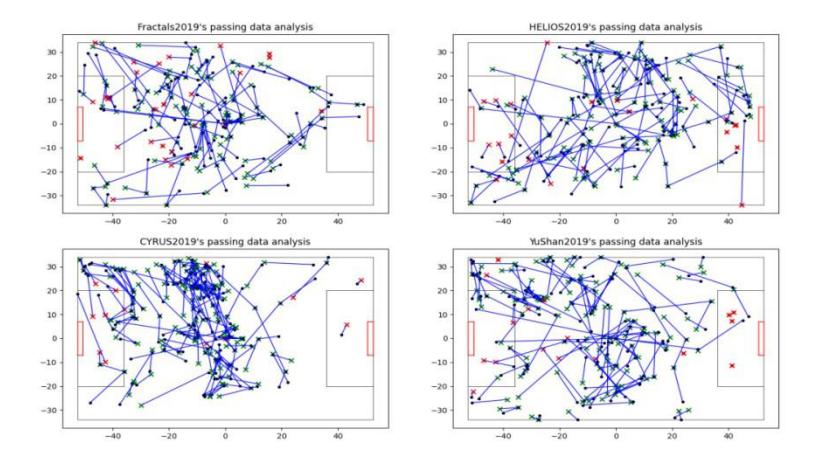
Extract all pass-related information from rcg and rcl files and draw the pass-related information with Matplotlib. We assume that if the current holder unum and side (sides are divided into left and right, left means the team that is attacking from left to right and right means the team that is attacking from right to left.) are the same as the next holder unum and side in a certain period, the same player is considered to be carrying the ball. If the unum of the ball handler changes and the side remains the same during the following period, the ball is considered to have been passed to one of his teammates. If the side changes, the pass is considered a failure. Figure 1 shows the schematic diagram of passing information in the game logs of MT and multiple teams. The black dot represents the position of the ball on the field before passing the ball. A red cross indicates a failed pass; A green cross indicates a successful pass. Table 1 shows the analysis of the pass success rate in 100 matches between MT and multiple teams.
Passing success rate analysis.
| Analyze pass success rates from 100 games | ||||
|---|---|---|---|---|
| team | success rate |
total passes |
number of successes |
number of failures |
| MTvsFractals2019_MT | 0.8255 | 19306 | 15938 | 3368 |
| MTvsFractals2019_Fractals2019 | 0.8034 | 17333 | 13926 | 3407 |
| MTvsHELIOS2019_MT | 0.8548 | 18668 | 15957 | 2711 |
| MTvsHELIOS2019_HELIOS2019 | 0.8512 | 18439 | 15695 | 2744 |
| MTvsCYRUS2019_MT | 0.9194 | 23160 | 21293 | 1867 |
| MTvsCYRUS2019_CYRUS2019 | 0.9033 | 18024 | 16281 | 1743 |
| MTvsYuShan2019_MT | 0.8507 | 18039 | 15346 | 2693 |
| MTvsYuShan2019_YuShan2019 | 0.8527 | 18631 | 15886 | 2745 |
From Figure 1 and Table 1, we can see the passing characteristics and passing success rate of the analyzed team, and then analyze the offensive and defensive playing methods of the team.MT has made corresponding defensive strategies for different teams' passing styles, and its defensive ability has been improved.
Analysis of the opponent's shoot action
Shoot is the most important action in a football game. It is the most important mea sure of a team's strength. Using data mining algorithm to shoot analysis can help us to understand the shooting characteristics and shooting ability. We extracted information about shoot from a large number of MT and other teams' game log files, such as the coordinate of our defensive player, the coordinate of the goalie, the coordinate of the shooting point, the coordinate of the goal point, the Angle of shooting, the partial velocity of the x coordinate when shooting, the partial velocity of the y coordinate when shooting, the partial velocity of the x coordinate before the goal, and the partial velocity of the y coordinate before the goal. At present, we have excavated and analyzed the successful shots of several teams, and obtained their customary range distance, shooting point coordinates, speed, Angle, and goal point coordinates. Figure 2 is a diagram of analyzing the shooting path of the opponent, in which the red cross represents the shooting point, the green cross represents the goal point, and the blue line represents the shooting path. Figure 3 is a graph analyzing the length of shooting path, where the abscissa represents the range and the ordinate represents the number of times that happens. Figure 4 is a graph analyzing the shooting speed and goal speed. The abscissa of the upper figure in Figure 4 represents the shooting speed, the abscissa of the lower figure in Figure 4 represents the speed before the goal goes in, ordinate represents the number of times that happens.
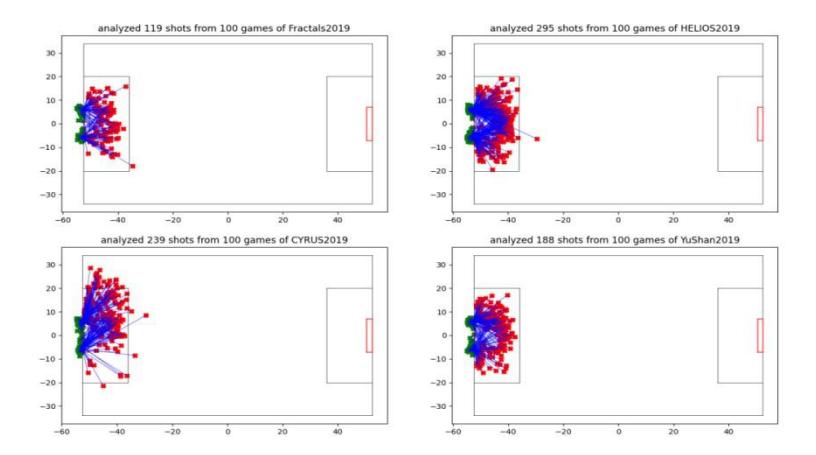
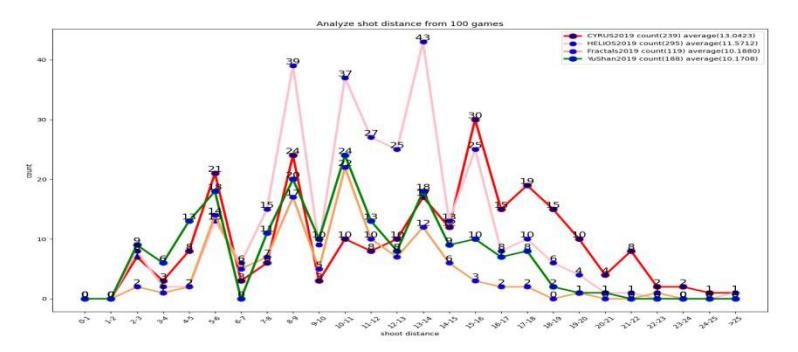
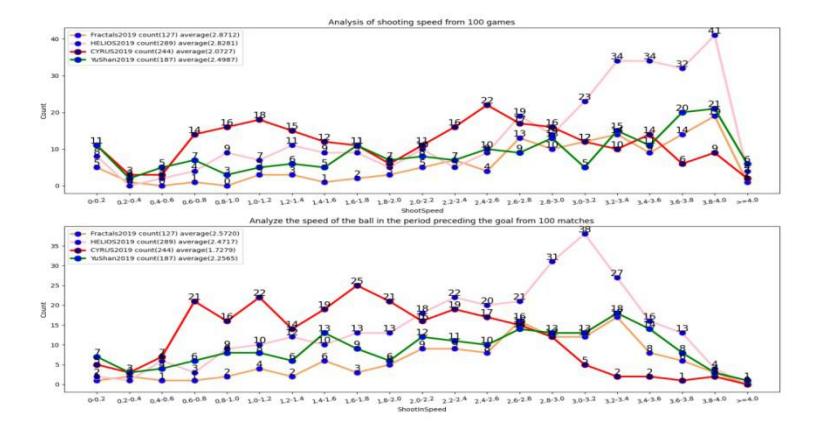
Based on the analysis of the shooting data of each team, we get the shooting characteristics of them. In terms of range, CYRUS2019 has many long-range shots outside the big penalty area compared with other teams, and its average range is the largest. In terms of shooting speed, Fractals2019 has the fastest average shot and HE-LIOS2019 had the highest shooting frequency. And timely to the MT goalie and defense players in the penalty area to make targeted adjustment, including the goalie and defense players running, marking, intercept, pouncing and other actions, from the current test results, the defensive effect compared with the previous better.
Analysis of opponent running position characteristics
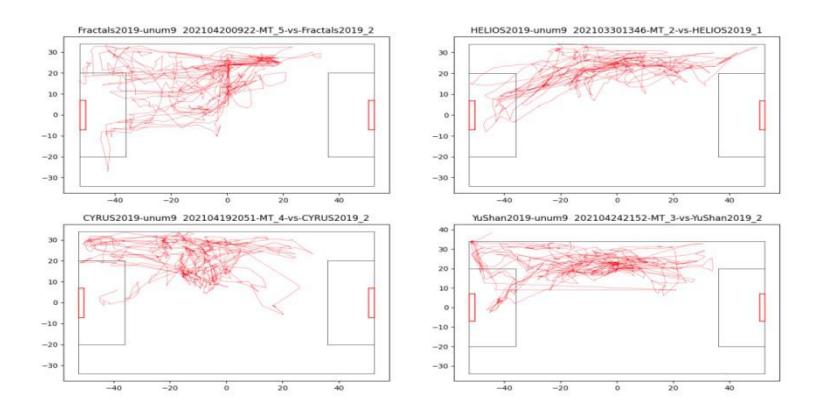
We extracted the opponent's position on the field from the match log file. The movement path of the opponent in the match is plotted, as shown in Figure 5, where the red line represents the full-court running path of No. 9 player of other teams. Through the running path diagram, we can directly see the running situation of the players on the field. It can help us to understand and analyze the characteristics of opposing players' offensive and defensive running positions, and adjust the MT's offensive and defensive strategy rate accordingly. After we revised and debugged the code in a timely manner, MT's offensive and defensive movement is much more targeted than before.
Stamina analysis
Every player on the pitch has a ceiling on his or her stamina. Every player uses a lot of stamina, so he or she needs to use his or her stamina in a more reasonable way. For example, the stamina of the midfield player is much larger than that of other players. When approaching the end of the first and second halves, it is easy to appear physical overdraft and become zero. In particular, MT's defensive midfield number 6 in the 433 formation was prone to the energy pool (That's the total amount of stamina that can be invoked) turning to zero towards the end of the first and second halves. We extracted the energy value information of MT and other teams from the log files of a large number of matches. After processing, as shown in Table 2, it analyzed the energy pool situation of player No. 6 when the 5999th cycle in 100 matches between MT and other teams. From Table 2, It can be seen that YuShan2019's No. 6 has the lowest average energy pool. HELIOS2019 has the highest average energy pool, and the energy distribution is reasonable. We have adjusted the position code of No. 6 of MT specifically to reduce unnecessary physical energy consumption and allocate physical energy more reasonably. Other players have also made adjustments. After our tests, we found that players were able to use their energy more rationally than before, and that individual players had less unnecessary energy expenditure.
Stamina analysis.
| Analyze number 6 player's stamina(5999 cycle) from 100 games | |||
|---|---|---|---|
| team | average | total stamina | total number |
| MTvsFractals2019_MT | 41857.69 | 4185769.28 | 100 |
| MTvsFractals2019_Fractals2019 | 356.33 | 35632.73 | 100 |
| MTvsHELIOS2019_MT | 2898.04 | 289803.77 | 100 |
| MTvsHELIOS2019_HELIOS2019 | 19374.73 | 1937473.23 | 100 |
| MTvsCYRUS2019_MT | 5682.06 | 568206.49 | 100 |
| MTvsCYRUS2019_CYRUS2019 | 849.94 | 84993.9 | 100 |
| MTvsYuShan2019_MT | 1319.39 | 131938.95 | 100 |
| MTvsYuShan2019_YuShan2019 | 271.75 | 27175.34 | 100 |
Further improvements to the through pass
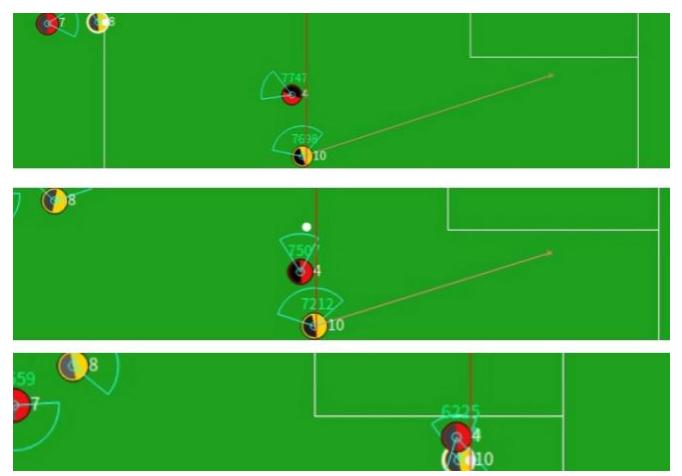
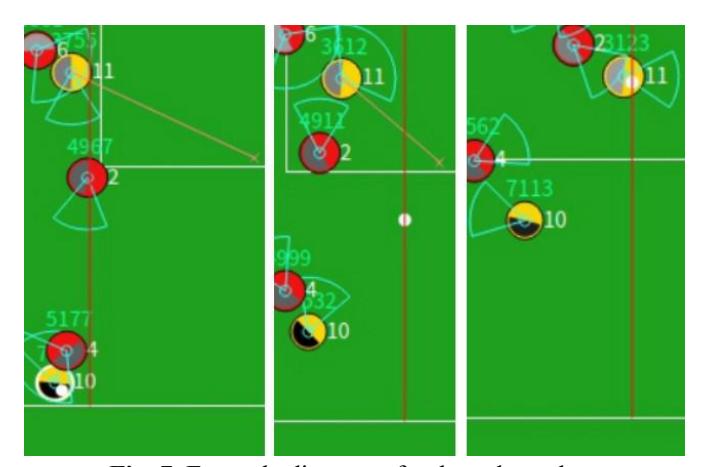
Through pass is a common technique used by the attacking team to penetrate the opposing team's defensive formation. The essence of this is to find open positions in the defensive formation and play through passes, as well as diagonal runs. The ball is usually played by cutting through the opposition's defence and creating an excellent scoring opportunity for the defending team. Through pass, as the name suggests, after the team players get the ball (usually the midfielder) to observe the opponent's defense space, or the direction of the forward running to give timely delivery, and such a pass like a sharp knife straight into the opponent's hinterland, offensive, need to be very precise, very timely. We tried to further optimize the MT's through pass, further dividing the through pass into long through pass (passing distance greater than 20m) and short through pass (passing distance less than 20m). The long through pass is used on the counter attack to move the ball efficiently and quickly behind the opponent over long distances. A short through pass used to get the ball behind an opponent's back in the penalty area and break down their defence. Through repeated attempts to optimize the algorithm, modify the code, and conduct a lot of testing, we further optimized the MT's through pass, and the MT's offensive ability became a little bit better than before. Figure 6 and Figure 7 show a successful MT's long through pass and short through pass.
Formation strategy rate
As we all know, the formation of a team is very important to a team. We added a new 343 formation and used the formation editing tool Fedit 2 0.0.0 to modify 343, 4231 and 442, with modify the move code as appropriate to try these formations in the game. After testing, we found that the new formation strategy had some effect on MT.
Field_evaluator Evaluator optimization
Our assessment of passing and dribbling has been further refined to allow for better cross low. We made the following adjustments to field_evaluator: before, when the forward holds the ball on the wing and meets an opponent who is not very threatening, the ball will be passed back to the midfielder, adjust forward to have a slightly higher priority dribble than with the pass, try to continue to dribble and cross low. And adjust the priority of the pass to the side receiver to be slightly higher than the middle receiver (when the receiver is out of the penalty area). At the same time, the priority of the through pass should be increased, so that more through passes can be sent to cooperate with the cross low. After testing, it is found that the frequency and quality of cross low are better than before.
Summary and Prospect
Since the establishment of MT team, we have been trying to optimize the algorithm, enrich the playing methods and adjust the attack and defense strategy rate, so as to make the team actions more efficient and the overall cooperation more intelligent. We've tried a lot of things, some good, some bad, and there are many more challenges ahead, and we're going to continue to invest a lot of energy in RoboCup2D.We look forward to communicating and cooperating with excellent teams from all over the world to make progress together, and wish RoboCup2D better and better.
References
- RoboCup Official Site, http://www.robocup.org/.
- LP. Kalebling, M L Littman, A. W. Moore. Reinforcement learning: Asurvey [J]Journal of Artificial Intelligence Research 1996 4 237- 285.
- Hidehisa Akiyama, Tomoharu Nakashima, Takuya Fukushima, Yudai Suzuki, and An Ohori, HELIOS2019 Team Description Paper, The 23th annual RoboCup International Symposium, Australia, 2019.
- Zheng Yang, Ziqiang Liu, Xiaorui Wang, Ning Dong, Xiangben Hu, JingLi, Shengbing Chen, Gang Lv, MT2018 Team Description Paper, The 22th annual RoboCup International Symposium, Canada, 2018.
- Song Yuan, Liu Qian, Wang can, Cheng Zekai. Research and application of robocup2d log file data mining. Journal of Daqing Normal University, 2015.
- Chen Bing, Zhang Heng, Cheng Zekai, Dong Peng, Lin Chao. Mining and verification of attack behavior in robocup2d simulation confrontation. Journal of system simulation, 2018.
- Akiyama, H.: Agent2D Base Code. http://www.rctools.sourceforge.jp.2015.
- Baofu Fang.Robot Soccer Simulation[M]. Hefei University of Technology Press, 2011.
- Robot soccer simulation design and implementation of China University ofScience and Technology.
- Akiyama H., Nakashima T. (2014) HELIOS Base: An Open Source Package for the RoboCup Soccer 2D Simulation. In: Behnke S., Veloso M., Visser A., Xiong R. (eds) RoboCup 2013: Robot World Cup XVII. RoboCup 2013. Lecture Notes in Computer Science, vol 8371. Springer, Berlin, Heidelberg. https://doi.org/10.1007/978-3-662-44468-9_46.