YuShan2021 Team Description Paper for RoboCup2021
Zekai Cheng, Feng Zhang, Bolun Guang, Liting Wang
Department of Computer Science, AnHui University of Technology, MaAnShan, P.R.China
Abstract YuShan Soccer 2D Simulation Team was established in 2009, affiliated with AnHui University of Technology in China. Having participated in RoboCup six times since 2012, YuShan team ranked 4 th in the RoboCup2019 in Sydney, Australia and won three consecutive championships in RoboCup China Open Tournaments from 2016 to 2018. In recent years, YuShan team has used data mining technology to analyze the characteristics of the team, and on this basis, proposed a digital twin framework. In the formation, player movement, passing analysis, shooting strategy, offensive and defensive judgment as well as other aspects have achieved some results. The development of YuShan 2020 is depended on YuShan base, and YuShan base is based on the reconstruction project of agent-2d3.1.0 [1], mainly including attack module and defense module.
1 Introduction
YuShan Soccer 2D Simulation Team was established in 2009, affiliated with AnHui University of Technology in China. Having participated in RoboCup six times since 2012, YuShan team ranked 4 th in the RoboCup2019 in Sydney, Australia and won three consecutive championships in RoboCup China Open Tournaments from 2016 to 2018. In recent years, YuShan team has used data mining technology to analyze the characteristics of the team, and on this basis, proposed a digital twin framework. In the formation, player movement, passing analysis, shooting strategy, offensive and defensive judgment as well as other aspects have achieved some results. The development of YuShan 2020 is depended on YuShan base, and YuShan base is based on the reconstruction project of agent-2d3.1.0 [1], mainly including attack module and defense module.
2 Three layer architecture based on digital twin framework
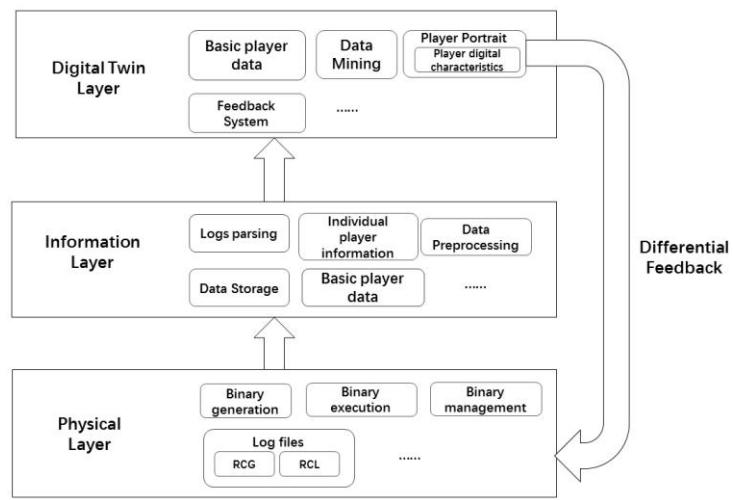
In 2019, YuShan team proposed a framework namely simulation 2D digital twin. Based on this framework, the team built portraits for each team, and YuShan 2020 was further optimized. As shown in Figure 1, the digital twin framework is divided into three parts: the physical layer, the information layer and the digital twin layer. The main function of the physical layer is to generate and manage the binary. The information layer mainly processes and analyzes the log files. The digital twin layer establishes the team portrait, and feeds back the differences between the portraits to the physical layer to find a new research and development direction [2]. Based on the idea of digital twin framework, YuShan analyzes the gap between the team and the strong team in shooting, passing, formation and physical strength, so as to adjust the tactical strategy of the team in time, improves the performance of the team's attack and defense as well as the stability of passing and receiving the ball.
3 Using HFO to build the team's overall portraits
Generally speaking, the basis of judging the strength of a team is the score. Different teams have differences in attack and defense. How YuShan comprehensively analyzes the internal factors of the team's strength is the key to the team's research and development. YuShan2020 uses HFO [3] (half field offense) open-source tools to collect team information and build a comprehensive and overall digital portrait for the team. HFO is a local attack and defense drill platform limited to half court, which provides a standardized tool to evaluate the team's attack and defense performance. According to this characteristic of HFO, YuShan obtains the attack performance and defense performance metrics of the team.
HFO can set any attack and defense mode, YuShan adopts 6vs8 mode, that is, the attacker considers the forward and midfield players, and the defender considers the defender and midfield players. Each round of test is set to 10000 cycles. YuShan utilizes TR, TG, DC, BOB, GR and other indicators to analyze the overall performance differences between teams. The above indicators can be obtained by using the python script provided by HFO, and the indicators are shown in Table 1.
Table 1. Definition and description of each indicator
| Symbol | Unit | Meaning |
|---|---|---|
| TR | times(t) | The total number of rounds |
| TG | times(t) | The total number of goals |
| DC | times(t) | The number of defenders captures |
| BOB | times(t) | The number of balls out of bounds |
| GR | percentage(%) | Goal rate (the ratio of total goals to rounds) |
HFO test adopts A-{B1,B2,… ,Bn} (a team and n Bi teams are tested respectively, referred to as A-NB) mode. The main purpose is to analyze the performance differences of different teams, such as offensive performance, defensive performance, combined with these differences, to further measure the overall performance of the team. YuShan selected base (agent2d), Helios 2013 [4], MT2019, YuShan2019, YuShan2013, YuShan2011 and other teams' binaries to test 75 rounds of matches in HFO environment in turn, and integrated and saved the original test data to CSV file. Table 2 selects some fragments of the original data.
Table 2. Partial fragments of the original data
| Teams | TR | TG | DC | BOB | GR |
|---|---|---|---|---|---|
| YuShan2019-Base | 163 | 36 | 99 | 28 | 22.1 |
| YuShan2019-Base | 171 | 50 | 81 | 40 | 29.2 |
| YuShan2019-Base | 172 | 40 | 95 | 37 | 23.3 |
| Helios2013-Base | 102 | 34 | 40 | 28 | 33.3 |
| Helios2013-Base | 93 | 31 | 37 | 25 | 33.3 |
| Helios2013-Base | 89 | 31 | 35 | 23 | 34.8 |
The component matrix, also known as the factor load matrix, is the coefficient of the factor expression of each original variable. The component matrix shows the influence degree of the extracted common factor (principal component) on the original variable. When extracting common factors, factor analysis not only pays attention to whether the variables are related, but considers the strength of the correlation, which makes the extracted common factors not only play a role of dimension reduction, but can be well explained. YuShan uses the principal component extraction method of factor analysis to transform the original data into the form of component matrix, so that the common factor can be interpreted with the original variable with large load, so as to better explain the impact of each metric on the attack and defense performance.
It can be seen from the composition matrix in Table 3 that the first common factor is mainly interpreted by TG and GR, and the second common factor is mainly interpreted by DC and BOB. Therefore, YuShan takes the TG and GR of the first common factor as the indicators to measure the offensive performance of the team, and the DC and BOB of the second common factor as the indicators to measure the defensive performance of the team.
Table 3. The composition matrix after conversion of the original data
| Performance indicator | Component 1 | Component 2 |
|---|---|---|
| TR | -0.049 | 0.296 |
| TG | 0.902 | 0.310 |
| DC | 0.003 | 0.848 |
| BOB | -0.754 | 0.558 |
| GR | 0.897 | 0.278 |
Based on the results of component matrix analysis in Table 3, YuShan analyzes the performance differences of each team from two aspects of attack and defense, so as to establish the overall portrait of the team. Through the visualization of the integrated data, the team's attack performance chart and defense performance chart are obtained. The attack and defense performance are described by radar chart. The performance difference of the team is reflected by the encircling area and extending distance of the corresponding curve of different indexes/metrics on the radar chart.
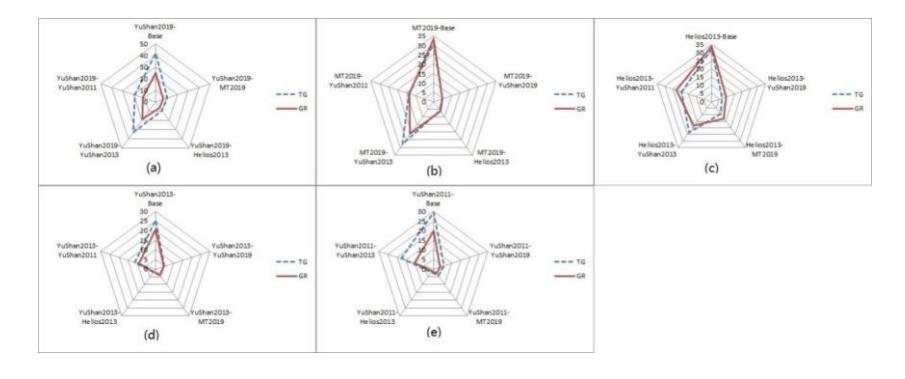
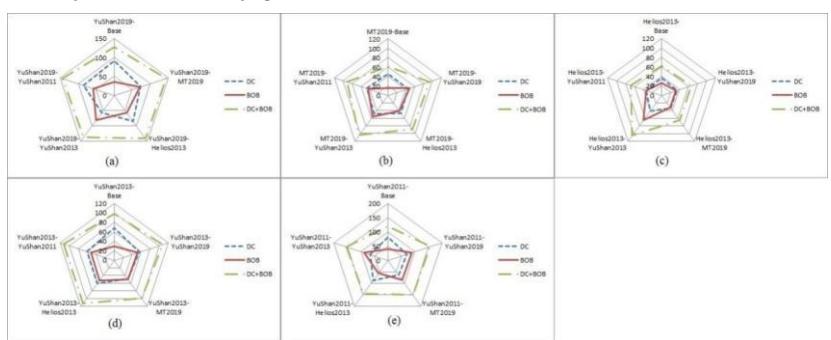
Table 4. The comparison of the overall team portrait
| Teams | Offensive intensity | Offensive stability | Defensive pressure | Defensive intensity |
|---|---|---|---|---|
| YuShan2019 | ☆☆☆☆☆ | ☆☆☆ | ☆☆ | ☆☆☆☆ |
| MT2019 | ☆☆☆☆ | ☆☆☆☆ | ☆ | ☆☆☆ |
| Helios2013 | ☆☆☆☆☆ | ☆☆☆☆☆ | ☆☆☆☆☆ | ☆☆☆☆☆ |
| YuShan2013 | ☆ | ☆ | ☆☆☆☆ | ☆☆ |
| YuShan2011 | ☆☆ | ☆☆ | ☆☆☆ | ☆ |
Combined with the differences between the team's overall portraits, it can be concluded that a strong team (such as Helios) generally improves its overall stability performance to the maximum extent under the premise of ensuring the attack and defense intensity. Therefore, YuShan takes the offensive and defensive performance of the team as the focus of research and development. Through the analysis of the key areas of the team's attack, the team's attack portrait is constructed, and the similarities and differences in the attack and defense strategies of different teams are obtained.
4 Analysis on the key areas of team attack
In 2019, Helios extracted kick data by processing log files, and analyzed the similarity of kick data of different teams to find the commonness between teams[5] . There are some similarities and differences between different teams in offense and defense. In the game, the key to the victory of the enemy is the offense and defense, if the other team can defense the key areas of offensive will reduce the team's points. YuShan used to watch a lot of video to find weak defensive areas and key offensive areas, which took time and effort. It would be more scientific and reasonable to use data mining technology to analyze the weak defensive area and the key offensive area according to the characteristics of each team. Based on this, YuShan conducted in-depth research on the problem of targeted defense in key areas of attack for different teams.
In the research process of the team's attacking key areas, we are divided into the following steps:
Step1: Through the analysis of the log file, draw the players' attack path diagram and the players' passing relation diagram.
Step2: The distribution of the position of the ball in the attacking path is analyzed to divide the court.
Step3: The adaptive density clustering algorithm is used to locate the balls in different areas to obtain the key areas of the team's offense.
Step4: The defensive strategy is obtained by comparing the key player's passing sequence to the key area of the offense.
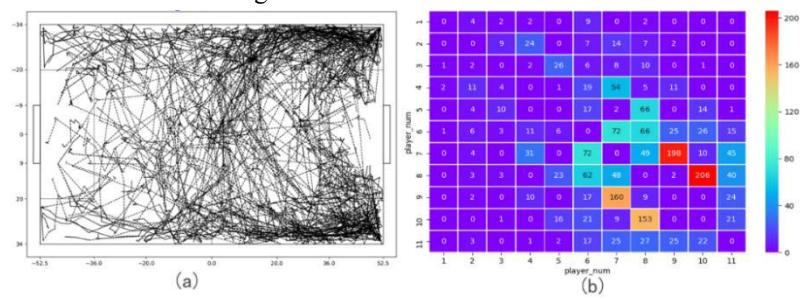
YuShan first parsed the log files from the game, extracting information from the RCG and RCL files about where the ball was when our players issued the kick command. If successive kicks are given by our players, we call the sequence of kicks a chain of action. If the chain starts in our half and ends below the other team's penalty area (the ball position coordinates X>36.0), we call this chain an offensive chain. YuShan links the position coordinates of the balls in the chain of all offensive moves in a game to get a team's chain of offensive moves. As shown in figure 4.1(a), the offensive movement chain diagram of a team on the left side.
4.1 Course Area Division
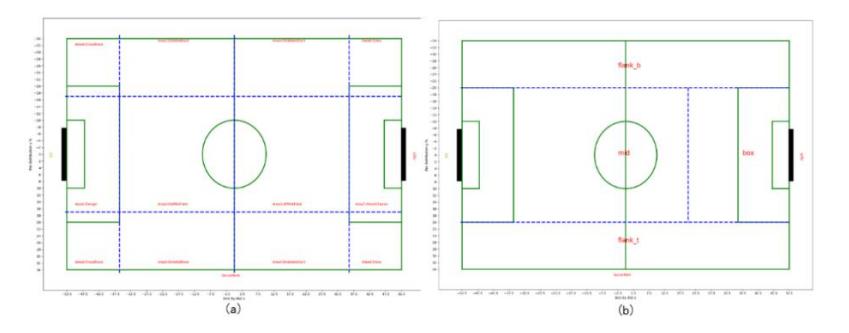
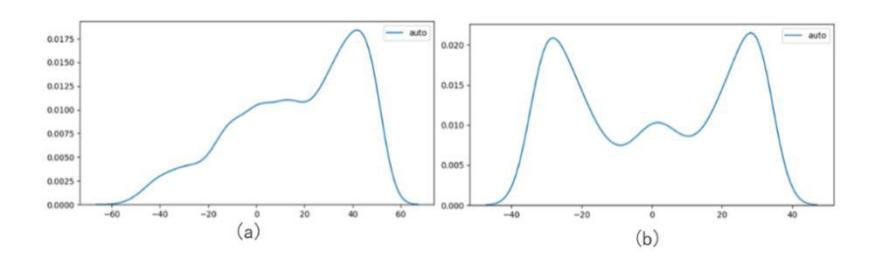
The traditional way of partitioning is through figure 6.2(a), but the partitioning is fixed. By analyzing the movement chain of the team in the game, it can be known that the team's offensive path has different focuses, that is, the position of the ball is not evenly distributed in the whole court, and there is a big gap between different areas. In light of this fact YuShan used a dynamic zonal algorithm to calculate the team's key areas on offense.
4.2 Analysis of key areas of Offensive
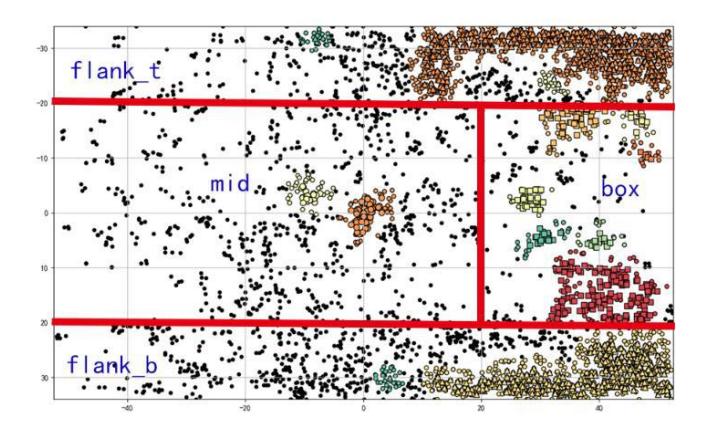
After using the dynamic field division method, we divided the field into four parts and used the adaptive DBSCAN algorithm to cluster the team's offensive key areas for each part. Since the density clustering (DBSCAN) algorithm [8] is insensitive to outliers of data and can cluster any shape that conforms to the actual clustering, YuShan adopted the DBSCAN algorithm with adaptive parameters to cluster the location points in different regions. DBSCAN algorithm for adaptive parameters is to generate candidate cluster radius (Eps) and cluster point (MinPts) parameters by using the distribution characteristics of the data set, automatically find the stable interval of cluster number change of clustering results, and take Eps and MinPts with the minimum density threshold in the region as the optimal parameters [6] . Using the algorithm, YuShan found that the number of points in each zone was very large, as the number of matches tested was more than 10, in particular, the middle and side can reach more than 10,000 points. Because this algorithm needs to calculate the distance between every two points to form the distance matrix, the size of the distance matrix formed is very large and the time complexity is very high. To solve this problem, YuShan adopted the method of systematic sampling to sample areas with too much data, effectively reducing the time complexity while keeping the data distribution as constant as possible. Figure 4.4 shows that the field is divided into four regions of flank_t, flank_b, mid and box through data distribution. Triangles, triangles, circles and squares are used to represent the clustering points in each region, and the clustering results are obtained according to DBSCAN algorithm of adaptive parameters.
4.3 Defensive strategy analysis
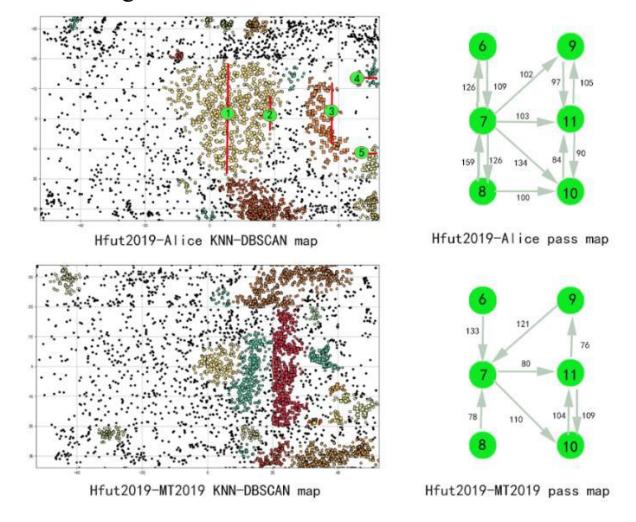
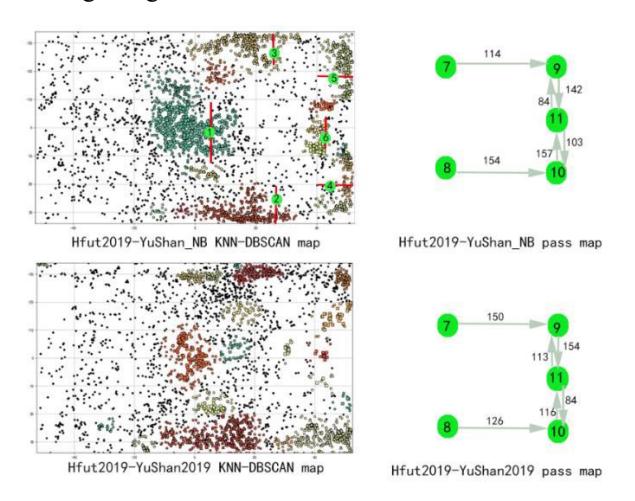
In the physical layer, YuShan selected the Hfut2019(national competition) team as the benchmark and tested them in Alice, MT2019, YuShan_NB and YuShan2019 respectively. 10 matches were played between each team and RCG and RCL data generated for every 10 matches were kept separately. Extract the offensive action chain of each game, and store the attack action chain of every ten games in the same file, and divide each action chain by newline.
In the digital twin layer, the ball's position coordinates are extracted for each action chain, and the gaussian kernel function is used to fit the ball's position points on the offensive action chain. The fitting results are shown in figure 4.5. It can be seen from the data distribution map that the data distribution of Hfut2019 is very similar to that of Alice and MT2019, and that of Hfut2019 is very similar to that of YuShan_NB and YuShan2019. The data distribution regions of different test teams and the calculation results of adaptive Eps and Minpts in different regions are shown in table 4.6.
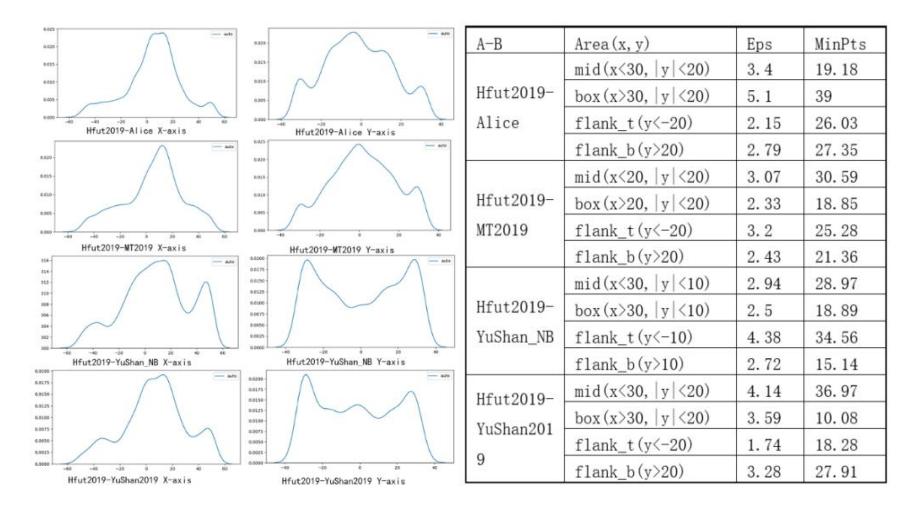
Table 4.6 adaptive Eps and Minpts values
YuShan divided each pair of test teams' pitches according to their data distribution and conducted an adaptive DBSCAN cluster within each zone to obtain their attack critical areas. According to the heat map of passing, the key players (players who pass more than 70 passes to each other are regarded as key players) are taken out. The passing sequence pairs are shown in figure 4.7. It can be seen from the clustering results and the key player passing sequence pairs that Hfut2019 plays very similar to Alice and MT2019, and YuShan can get its offensive characteristics:
4.4 Simulation experiment and results
In the feedback layer, we selected hfut2019-yushan_nb as the analysis object (Hfut2019 is referred to as team H and YuShan_NB is referred to as team Y), modified the YuShan_NB code, and carried out simulation experiment verification. According to the above analysis of the defensive strategy made the following three plans:
A: 6 players on team Y watches 11 players on team H. Team Y's 8 players ran between 7 players and 9 players, limiting team H's 7 players pass to 9 players. Team Y 7 players ran between team H 8 players and 10 players, limiting the pass from team H 8 players to 10 players.
B: on the side, team Y's no. 4 and no. 5 players execute the movement logic according to the maximum strength, prevent team H's no. 9 and no. 10 from going down the side, and modify the base point of team Y's no. 4 and no. 5 side to make it as close to the ball as possible.
C: based on plan B and A, team Y's no. 2 and no. 3 watch team H's players in the penalty area.
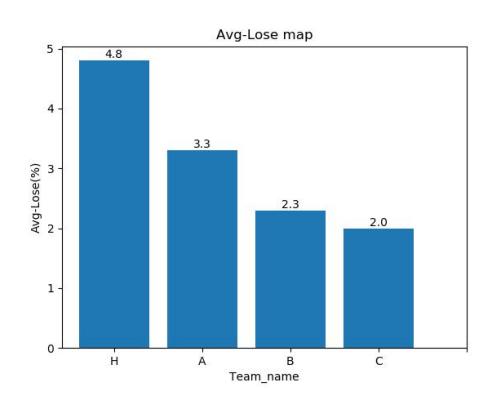
Let Hfut2019 play 10 matches respectively in the modified teams (hereinafter referred to as team A, team B and team C according to the revised plans of A, B and C), and record the number of goals, losses and times on the field in every 10 matches.
Table 4.9 Hfut2019 test data table with different teams
| Teams | goals | losses | avg | |
|---|---|---|---|---|
| Y | 0 | 48 | 0 | |
| A | 0 | 33 | 0 | |
| B | 1 | 23 | 0 | |
| C | 1 | 20 | 1 |
It can be seen from the table that after the improvement, team A, team B and team C lost A lot less than team Y. The number of lost balls extracted from the table is compared with YuShan_NB on the bar chart, as shown in figure 4.10.
5 Summary and Prospect
Based on the simulation 2D digital twin framework, YuShan2020 initially uses HFO open-source tools to build an overall portrait of the team, and on this basis, it makes an in-depth analysis of the different teams attacking key areas. Finally, it analyzes the differences between the portraits, guides the research and development direction of the underlying code, and effectively improves the overall performance of the team. YuShan will further build a more comprehensive team portrait, and at the same time consider combining human football game [7] with simulation 2D game, mining the common mode of the two. I would like to express my sincere thanks to hidehisa Akiyama and others for promoting the 2D alliance over the years.
References
- Akiyama, H.: agent2d-3.1.0 RoboCup tools. https://osdn.net/projects/rctools/downloads/51943/agent2d-3.1.0.tar.gz/
- ZeKai-Cheng, NingYu-Xie, Feng-Zhang. et al. YuShan2019 Team Description Paper for RoboCup2019, The 23th annual RoboCup International Symposium, Australia, 2019.
- Half Field Offense: https://github.com/LARG/HFO.
- Akiyama1, H., Nakashima, T., Yamashita, K. HELIOS2013: TDP for RoboCup2013.
- Fukushima, T., Nakashima, T., Akiyama, H. Similarity Analysis of Action Trajectories based on Kick Distributions. In: RoboCup 2019 Symposium, 8 July 2019, Sydney, Australia.
- Wenjie Li, Shiqiang Yan, Ying Jiang. et al. Research on method of self-adaptive determination of DBSCAN algorithm parameters. Computer Engineering and Applications, 2019, 55 (5): 1-7.
- Decroos, T., Van Haaren, J., Davis, J. Automatic Discovery of Tactics in Spatio-Temporal Soccer Match Data. In: Proceedings of the 24th ACM SIGKDD International Conference on Knowledge Discovery & Data Mining. pp. 223–232 (2018).