opuCI 3D Team Description Paper
Yosuke Nakamura, Floriane Sarzeaud, Tomoharu Nakashima
Osaka Prefecture University Gakuen-cho 1-1, Sakai, Osaka 599-8531, Japan
Abstract This paper describes opuCI 3D, our soccer team that has been submitted to the qualification for the competition of the 3D simulation league of RoboCup 2010. In order to check a robot behavior from an internal view point, a software tool we call visual debugger has been created. This visual debugger shows the following information on the screen: visible objects of the soccer field, the joint angles of the soccer agents, and text messages from the agents. Moreover, as it can be long and difficult to create and analyze a new behavior of an agent, a manually controlled agent has been included as a part of this software tool. The visual debugger is described in this paper.
1 Introduction
Osaka Prefecture University (OPU) has taken part in the RoboCup world competitions since 2002. First in 2D simulation league, then from 2005 in both 2D and 3D simulation league. Concerning the 3D simulation league, the team's name was OPU hana 3D from 2005 to 2008. Then it has changed in 2009 to opuCI 3D, which is the actual name of the team.
For the past few years, the team has been working on creating simple behavior such as walking and kicking using evolutionary approach. This year too, the team has been working on improving behavior but this time by developing and using a software tool.
In this team description paper, we present a software tool for the RoboCup simulation 3D: a visual debbuger, how to use it and how it helped us to develop a new behavior.
2 Visual Debugger 3D
2.1 Overview
The visual debugger is connected to a soccer agent via TCP/IP and receives information on the field and the agents internal status every cycle. The functions that the visual debugger provides make it easier for the team to develop agents. The soccer agent can send a one-line message to the debugger at each time step. The message contains the information on the state of the field and the agent. The visual debugger graphically shows the information on the display.
2.2 Description of the Visual Debugger
The one-line message sent by an agent to the visual debugger is called "debug message". The information sent by the agent is summarized in the following:
– Game State
The game state information consists of the game time and the playmode. The message format is specified as follows:
Format: time
Example: time 20.08 playmode PlayOn
– Visual Information
The agent receives the visual information from the soccer server in three dimensional polar coordinates. The visual information is then sent to the visual debugger as a three dimensional vector in Cartesian coordinates. This information provides the position of visible objects. The following is the message format of the visual information:
Format:
where
Example: ball true 0.2962 0.004343 -0.5102
– Joint Angles
Joint angles include the joint angles of the agent at the current time step. One message format corresponds to one joint angle. The following are the message format of the joint angle message:
Format:
where
– Gyro Information
Gyro information includes the value of the gyro sensor. The following is the message format of the gyro information message:
Format: gyro
Example: gyro 5.08 7.84 -19.34 fieldnormal 0.0112 -0.199 0.979
where
$$V_{fn}^{new} = V_{fn}^{old} \cdot R(V_g \Delta t)$$
where Vfn is fieldnormal, V^g is gyro, R is the rotate matrix and ∆t means the interval of one step. The debugger automatically calculates fieldnormal from gyro information only.
Then the visual debugger uses this message to display information. There are two display mode: normal display mode (which is graphical only) and numerical display mode.
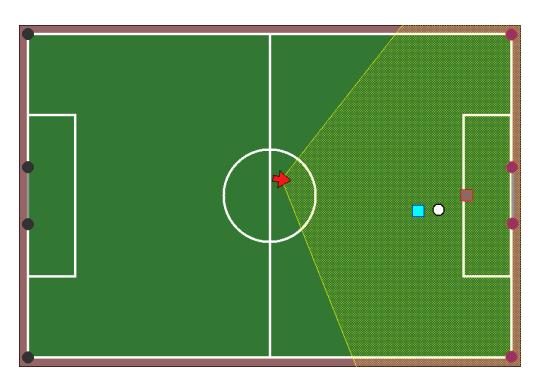
In normal display mode, the visual debugger shows visible objects in the soccer field within the agent's view cone. The debugger converts the position of the visible objects it receives from the agent into the absolute coordinates (i.e., the origin is set to the center of the field) and draws the overhead view of the soccer field.
Figure 1 shows an example of the overhead view of the soccer field: the red arrow within the center circle indicates the position and direction of the agent's torso, the yellow-shaded area in the right side of the field shows the eyesight of the agent, the white circle indicates the ball, the light-blue square indicates a teammate player, and the red square indicates an opponent player. The debugger draws each of the above objects when it is in the agent's eyesight. The position of landmarks such as flags and goal posts are described by violet circles (in eyesight) or black circles (out of sight). The positional relation among landmarks are pre-specified by the soccer server according to the official rule of the league. Therefore, if at least two landmarks are visible to the agent, the position of landmarks which are out of sight is computable.
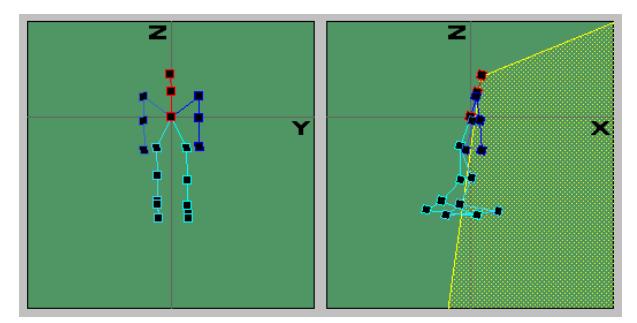
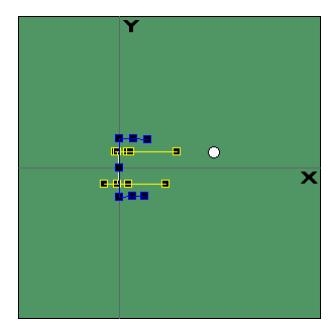
Moreover, the debugger draws the pose of the agent using the other information given by the agent (joint angles and gyro informtation), as well as the positional relation between agent's feet and the ball when it is in the eyesight. The agent's pose is shown in three views (frontal, sagittal and overview), and is represented by nodes and edges. In Figs. 2 and 3 red nodes indicate the head and torso of the agent, blue nodes indicate arm joints, and light-blue nodes indicate leg, heel, and toe joints. Yellow-shaded area is the eyesight of the agent. In the left image of Fig. 2, the horizontal axis and the soccer field are assumed parallel, and in the right image of Fig. 2, the vertical axis and the soccer field are orthogonal. The developer of the agent checks the pose of the agent from the two images in Fig. 2.
In numerical display mode, the previous graphical information are still shown, but also numerical information about the visible objects by the agent as ball position, flag position or goal posts position.
Another functionality of the debugger is to replay a game in the debugger without running the soccer server by loading a text file called "debug message file" which includes all debug messages sent by the agent during a game. The main difference between a debug message file and a log file is that the debug message file contains the internal information from the viewpoint of an agent while a log file just records the joint angles at each time step. While replaying a game from a debug message file, extra operations such as pause, go-to-next-step, or go-to-previous-step are available. By using this function, we can examine an agent's behavior in detail during a game. This function is also available while a soccer match is played.
Finally, a manually-operable agent has been developped to deal with issues like interactions with other agents (passing the ball to a teammate, avoiding opponent agents). Thanks to the manually-operable agent it is easier to examine those kind of behavior because we can reproduce easily specific configuration using an autonomous agent and a manually-operable agent, then controlling the manually-operable agent we can check the reaction of the autonomous agent and correct it if necessary.
3 Conclusion
This paper described the development of this year's team opuCI 3D. A visual debbuger was created and used to help to develop agents behavior. Future development includes acquiring other behaviors such as walking fast or running. These could be done with the help of the visual debugger that was described in this paper.