RIC-AASTMT RoboCup Soccer 3D simulation
Ahmed Ehab, Ahmed Hamdy, Hazem Essam, Khaled Waleed, Loay Akram, Mohamed EL kholy, Noran Mohamed, Osama Hesham, Yahya Alaa, Kareem Youssri
Department of Computer Engineering, Arab Academy for Science and Technology, Egypt
Abstract RIC-AASTMT is a newly founded team attempting to participate in the 2017 RoboCup simulation 3D. The base code used was UT Austin Villa's base code that was released in 2016. This paper discusses the optimization done to some of the basic low-level skills such as: walking and kicking, and also discusses the high-level structure of RIC-AASTMT code.
1. Introduction
RIC-AASTMT is the first Egyptian team taking part in RoboCup soccer simulation 3D qualification. As a new team, an adequate period of time was dedicated to calling for members and gathering resources. After the team members were recruited, each member started working on their assigned tasks on the 20th of December 2016. Although most of the team members had little experience in this competition, they were determined to build up their knowledge in a short period. Moreover, the team members have previous experience in several robotics and programming competitions such as: ACM, ROV, WRO and RoboCupJuniors achieving national and international ranks. With the help of UT Austin Villa's base code, the team managed to create their own code with optimized walk and kick, and high-level decision making. The optimization of basic skills was achieved by the CMA-ES machine learning algorithm, that was chosen among several other algorithms and was proven to output the best results. In addition, some high-level skills were developed such as: passing, dribbling, marking, supporting and intercepting the ball. Each of those actions has a weight according to the match's conditions and the position of the agent taking the decision. Based upon that, the agents choose the best possible action.
2. Optimization
Machine learning algorithm was used to achieve the most optimum parameters of the basic skills of the Nao robot. Among several algorithms, the team decided to try the most two efficient algorithms in similar types of problems. The two algorithms were the genetic and the evolutionary algorithms. According to UT Austin Villa's paper [1], the Covariance Matrix Adaptation Evolutionary Strategy (CMA-ES) proved its efficiency in this domain of problems. Therefore, the team decided to use this algorithm.
2.1 Walk optimization
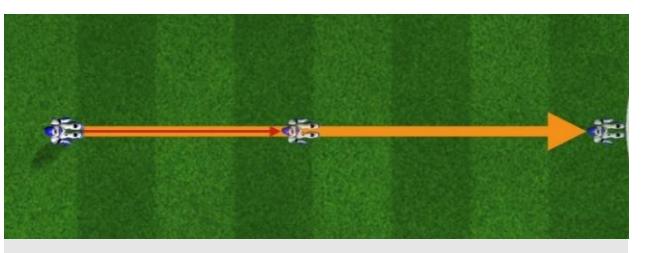
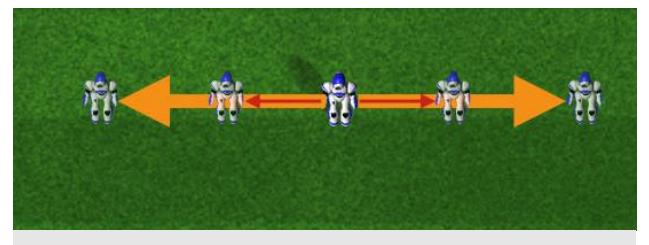
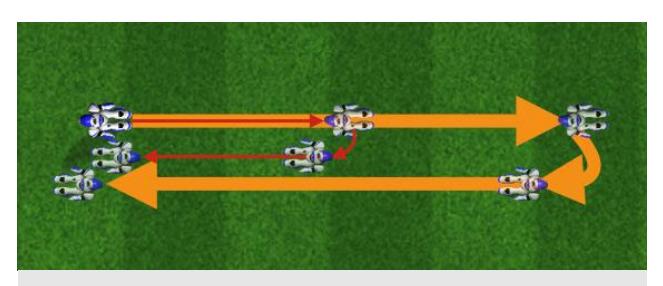
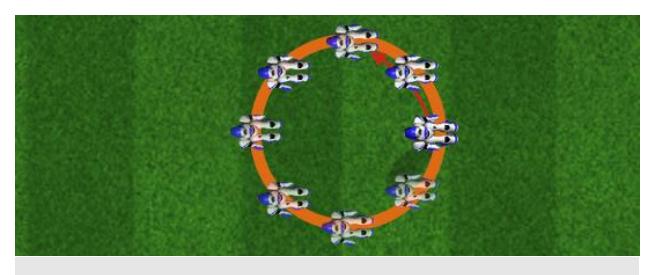
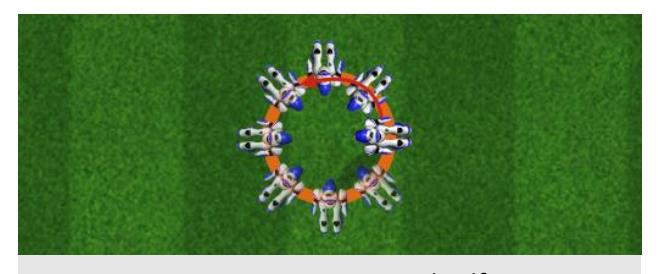
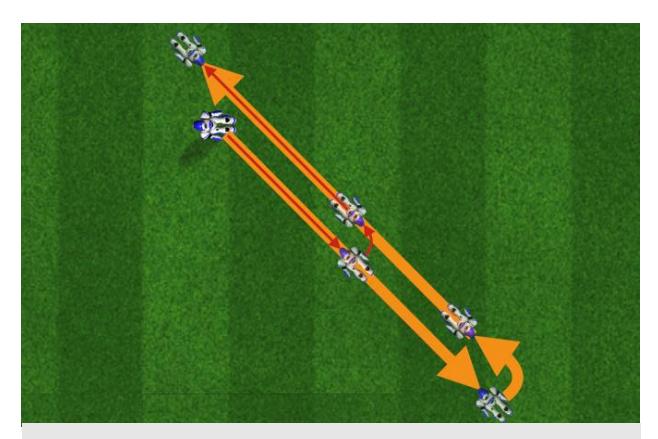
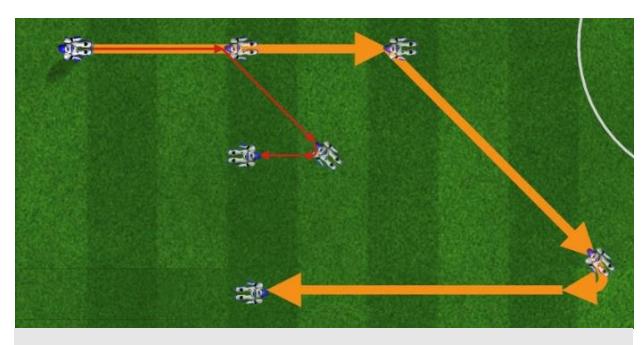
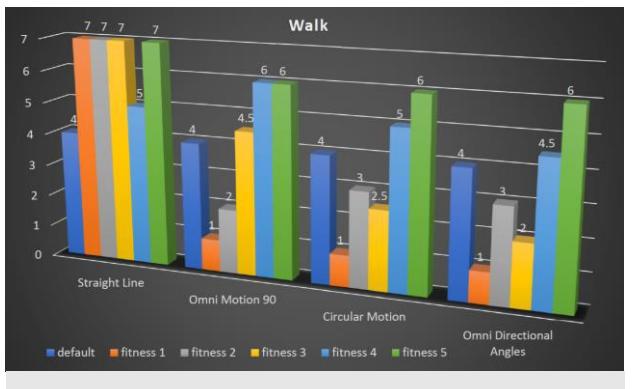
Several fitness functions were written to optimize the NAO's walk. The function runs for 10 times and then the average is taken, and 250 iterations with different parameter combinations are made to get the most optimum walk parameters. First, the team developed a simple fitness function that only moves the robot forward. This fitness resulted in a better forward sprint (as shown in figure 1) but there were several problems in turning and moving with different angles. After that, the team tried another function where the robot moves forward, moves in a 45° angle, turns and moves forward again (shown in figure 7). The robot still had problems with moving in different angles, so another fitness function was developed to handle these problems. The new function moves the Nao forward and turns and moves back which runs for 5 times (figure 3), then it moves laterally to the left and to the right which runs for the remaining 5 times (figure 2). Unfortunately, the robot's movement still was not optimum. The last fitness function developed combined all the previous fitness functions, where the robot moves forwards and backwards runs twice, the lateral 90° movement to the left and to the right runs twice, the 45° movement runs twice, rotation around itself runs twice and circular movement runs twice (figures 1,2,6,5 and 4). The results are shown in figure 9.
2.2 Kick optimization
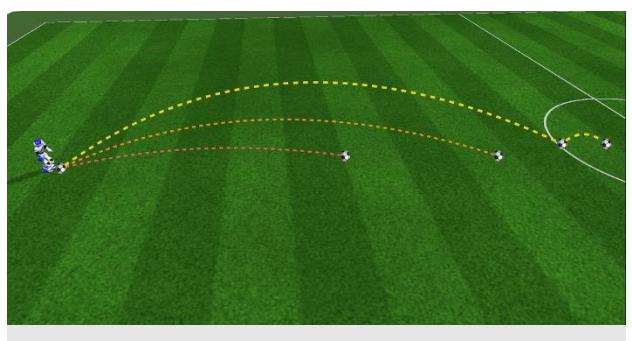
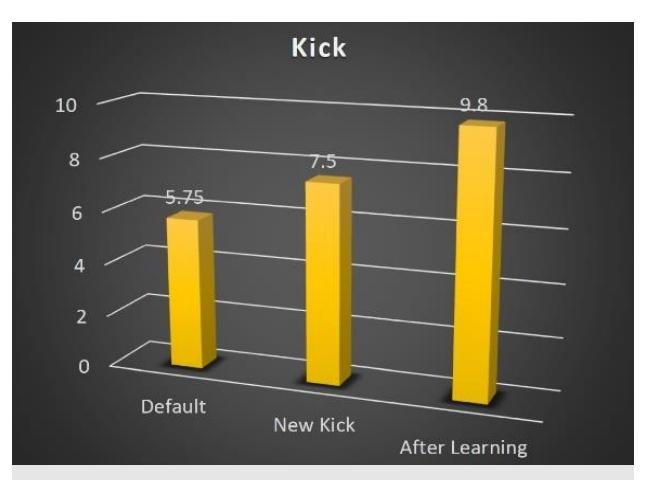
When attempting to optimize the parameters of the default kick using the machine learning algorithm, the results were not very satisfying. The kick's power was still less than needed and the distance the ball reaches was smaller than required. Therefore, the team developed a new kick which achieved better results as shown in figure 8. The new kick's parameters were then optimized, using the same machine learning algorithm with 350 iterations of different parameter's combinations. The new results are also shown in the bar chart in figure 10.
2.3 Parallel processing
Unlike other teams, our team had minimal resources and the team did not have servers to run the machine learning code and achieve results in a convenient time, as 200 agents must run at the same time which would not be possible on our computers. Thus, the team used 10 different computers to run these 200 agents parallelly, each computer running 20 agents simultaneously. This was achieved by the parallel SSH protocol, where the 200 parameters files outputted from the machine learning code are copied and distributed among the computers and the results are then collected and sent to the machine learning code again.
3. Skill Generation
Skills are created where each skill has an evaluated cost that represents the likelihood of selection of this skill. The cost is calculated by evaluation of several independent factors of the current state, summed by a parameter vector where Cs = [W0, W1, W2, W3, W4, ….] *[1, F1, F2, F3, F4, ….] The factors differ from each skill to another, and there is a factor of the skill type itself where some skills are always preferred to others. Skill costs are all scaled to unit range where costs are ranged from 0 to 1 except for skills that are impossible to select which are given costs near maximum value.
3.1 Pass Skill
Pass skill depends on several factors:
- Pass Safety: evaluation factor indicates the possibility of the ball to be obstructed during performing the pass.
- Goal Safety: evaluation of the threat level to concede a goal if the pass was obstructed or not delivered
- Goal effectiveness: evaluation of the likelihood to approach the opponents goal by performing the pass.
- Support value: evaluation of how much the ball receiver is supported by teammates
- Pressure value: evaluation of how much the receiver is pressed by opponents.
Skill generation
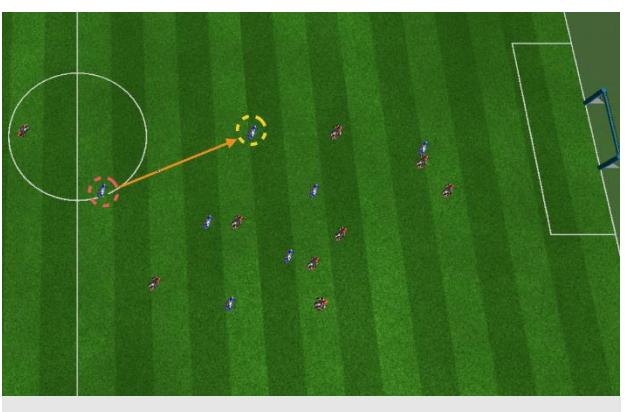
Pass skills are generated by top layer in 2 different routines. The first method generates normal passes by adding all outfield players as pass targets. The second method is to generate through passes by choosing the optimum point to deliver to each player. Optimum point is chosen by applying Gradient Descent on cost of the pass skill. Where a local minima is reached by iterating on the cost of past down to the least cost.
3.2 Shooting Skill
Shooting factors depend on only 2 factors:
- Shot Safety: evaluation of the possibility to block the shot.
- Shot Range: evaluation of shot range
3.3 Dribbling Skill
Dribbling factors depend on 2 factors:
- Dribble safety: evaluation of how safe it is to dribble in a certain direction.
- Effectiveness: how effective it is to dribble to a certain direction in approaching the opponents goal.
Skill generation
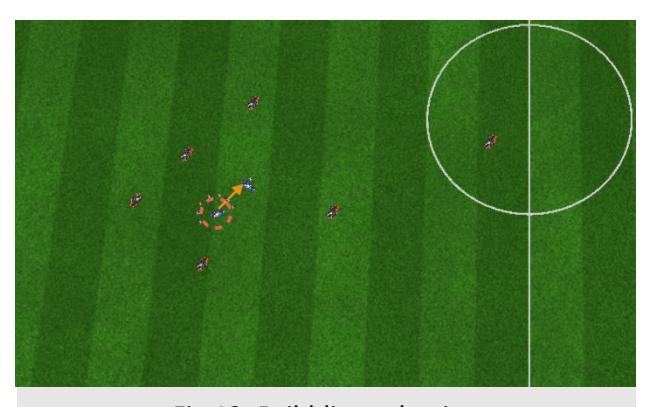
Dribble skills are generated by complete search over all possible dribbling angles within range allowed due to current pressure.
3.4 Marking Skill
Our marking strategy is man-to-man marking and depends on 2 factors
- Opponent Threat: evaluation of how dangerous is the target player if received the ball.
- Opponent Ability: evaluation of how able the player to receive a pass.
Skill generation
Marking candidates are generated by searching all opponent players which are closest to the marking player than any other player.
3.5 Intercepting Skill
Interception is a simple skill of targeting the ball when its and depends on 2 factors
- Distance to goal: players close to opponent have a higher priority than others to intercept and this factor is highly weighted.
- Current intercepting players: current pressure acting on the ball holder.
- Threat of opponent: as close the opponent to our goal interception cost is lowered.
Skill generation
Marking candidates are generated by searching all opponent players which are closest to the marking player than any other player.
4. Strategy Analysis
Since it is the first year for the team to take part in this competition, some of the team members were assigned to watch previous matches and analyse other teams' strategies. This allowed the team to have a general overview of how other teams think, which helped the team in having its own effective strategy that would be able to compete with other teams. This analysis included each team's formation, positioning while attacking and defending, strategy, shooting power and the behaviour of their goalie.
5. Results
The team has succeeded in optimizing the walk skill, resulting in a robot with a higher speed, which had a great impact on the overall performance of our code. Furthermore, the optimized kick has increased the average number of goals scored per match. Also, our decision-making module has proven its efficiency as the passing, shooting, dribbling, marking, supporting and intercepting skills are working as expected and our strategy analysis has proven its effectiveness when developing our own strategy as the team had an overview of almost all the teams which had participated previously in the competition.
6. Conclusion
With the optimizing of the basic skills and the development of the new ones, the team defensive skills improved gradually. The table below shows the improvement of the code. These values are the average of 10 trials with 5 different teams. After applying the improved filters and the new offensive strategies, the team would not only have a huge chance of winning, but would also become similar to real life soccer matches.
Performance comparison across versions
| Team Name | Version 1.0 | Version 1.1 | Version 1.2 |
|---|---|---|---|
| Magma | 6:0 | 4:0 | 4:0 |
| FUT-K | 8:0 | 5:0 | 4:0 |
| UT Austin Villa | 8:0 | 6:0 | 6:0 |
| FC Portugal | 7:0 | 5:0 | 4:0 |
| KgpKubs | 4:0 | 2:0 | 0:0 |
7. Future Improvements
The main aspect of our future improvements will be the offensive strategy and skills of the robots, as the defensive skills has already proven its competence. The team is willing to develop a smarter offensive positioning and to apply cross and through passes. Another thing is improving existing filters such as: Kalman filter, as one of our main problems was that the ball position had a high error percentage which affected the performance of the robots, especially the goal keeper. This would improve the overall performance dramatically, since all skills depends mainly on sensors' readings.
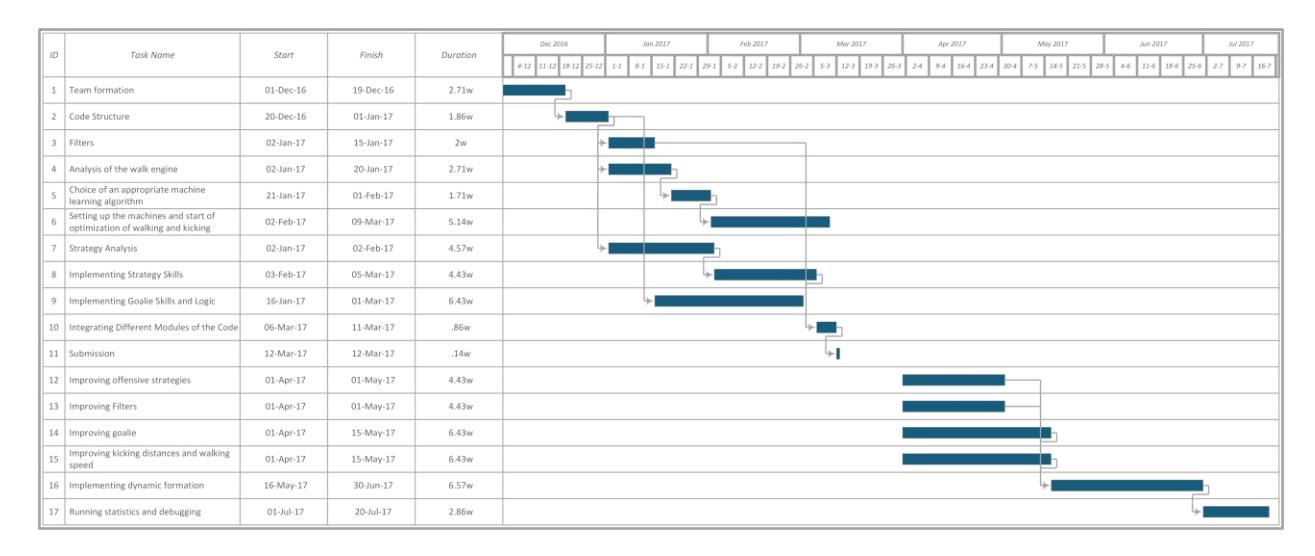
8. Gantt Chart
(See figure below)
9. Acknowledgments
We would like to express our gratitude to UT Austin Villa for publishing their base code and to thank the AASTMT for providing computers and a place to work in. We would also like to thank our mentor and team leader Kareem Yousri for his support and guidance.
References
- UT Austin Villa's paper on CMA-ES application (referenced in text)