TIGERs Mannheim
Mark Geiger, Nicolai Ommer, Andre Ryll, Michael Ratzel
Department of Information Technology Baden-Württemberg Cooperative State University, Coblitzallee 1-9, 68163 Mannheim, Germany
Abstract This paper presents the latest improvements in the passing strategy of TIGERs Mannheim, a Small Size League (SSL) team intending to participate in RoboCup 2025 in Brazil. This year, the ETDP will focus on the decision-making process behind pass selection, including pass generation, filtering, rating, and execution. We provide an in-depth look at the algorithms and heuristics that we continuously refined in recent years and that enable efficient and adaptive passing, ensuring strategic pass plays in dynamic game situations.
1 Terminology
Prior to presenting the pass strategy algorithm, we defines two core concepts in our terminology, which are important for understanding the remainder of this paper.
1.1 A Pass
We define a pass as a kicked ball with the following attributes:
- source: The position at which the ball will be kicked. This could also be a preceding pass target, where a robot redirects the ball.
- target: The position where the ball should be received.
- kick device: Either straight or chip.
- duration: The time the ball will need from source to target
- kick speed: The initial ball velocity at source.
- receiving speed: The ball velocity at target.
- shooting robot: The robot that will kick the ball.
- receiving robot: The robot that will receive the ball.
- receiving mode: Is the ball received and stopped at the target or immediately redirected.
- preparation time: The time that will pass, before the ball will be kicked.
In order to create such a pass, we require the following additional inputs:
- desired receiving ball speed: A constant speed for the receiving speed, when creating a pass. Other conditions may reduce the effective receiving speed. We set it to about 3m/s.
- minimum pass duration: How long should the pass take at a minimum, including the preparation time?
The kick speed, duration and receiving speed are calculated based on a calibrated ball model. For straight kicks, the optimal kick speed can be calculated through the ball model [1], given the desired receiving ball speed and can afterwards be reduced until the pass duration is below the minimum pass duration. For chip kicks, the kick speed is first calculated for a fixed number of touch downs, like 6. It is than further reduced, until receiving speed and min pass duration are achieved.
1.2 Moving Robots
We use the concept of moving robots in different areas of our software, like in path planning. It estimates the area in which an SSL robot can move within a certain time horizon based on a constant acceleration model. The estimated area is a time-dependent circle. In last years TDP [2] we explained in detail, how an accelerating moving robot is modeled for opponent robots. In addition to that, we define a stopping moving robot, that comes to a stop at the end of the considered time horizon.
The general moving robot is declared as a circle with radius $r_{movingRobot}$ and center $\vec{p}_{movingRobot}$ depending on time $t$ that defines the area in which the robot could potentially move within this time based on its movement limits. The circle is calculated with equations (1)-(4).
$$t_c = \begin{cases} 0 & \text{for } t < 0 \ t & \text{otherwise} \end{cases} \tag{1}$$
$$r_{dyn} = \frac{|f_{+}(t_{c}) - f_{-}(t_{c})|}{2} \tag{2}$$
$$\vec{p}{movingRobot} = \vec{p}{robot} + [\vec{n}{robot} \cdot (f{-}(t_c) + r_{dyn})] \tag{3}$$
$$r_{movingRobot} = r_{robot} + r_{dyn} \tag{4}$$
$\vec{p}{robot}$ is the current robot position, $\vec{n}{robot}$ is the normalized move direction of the robot and $r_{robot} = 0.09$ m is the robot radius. For accelerating moving robots, $f^{+}$ and $f^{-}$ are the 1D bang-bang trajectories [3] from position zero to positive and negative infinity with the current robot speed and its velocity and acceleration limits. For stopping moving robots, $f^{+}$ and $f^{-}$ are defined as the 1D bang-bang trajectories that maximize the distance towards positive and negative infinity, while reaching a robot velocity of zero at time $t$.
2 Pass Strategy
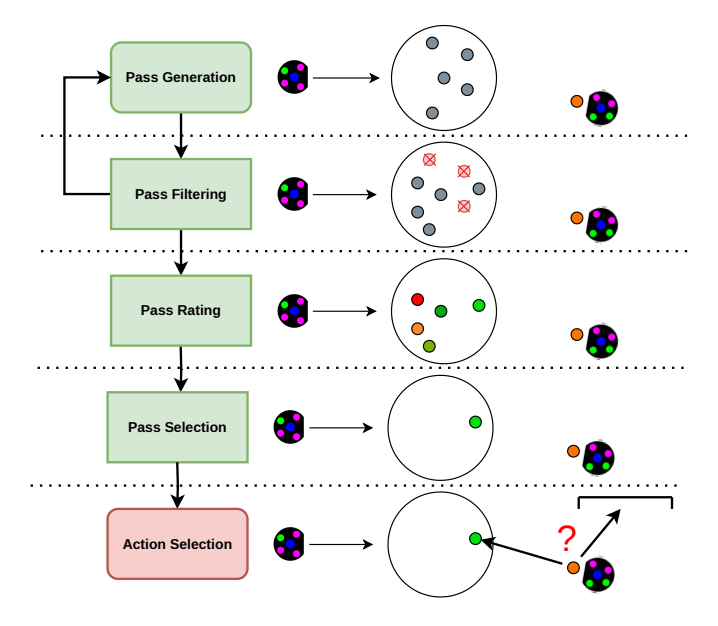
Our pass creation pipeline follows a structured sequence of steps, as illustrated in Figure 1. The goal of the pipeline is to identify the best possible pass or determine that no suitable option exists by generating, filtering, and evaluating multiple candidates. Each pass is assigned a set of ratings that assess its quality based on key factors such as the risk of interception, the likelihood of creating a scoring opportunity, and its overall strategic impact. The process begins with the Pass Generation, where we compute a broad set of possible passes for selected robots based on their local game state. These passes are then refined through an initial Pass Filtering stage, which removes unrealistic or overly risky options. If too many passes are eliminated, new candidates are generated until a predefined number of viable options is reached, with a maximum limit on retries to maintain efficiency. Next, in Pass Rating, each remaining pass is evaluated based on multiple criteria, including the chance to score directly, the potential for a redirected goal, the pressure exerted on the opposing team, interceptability, and overall passability. After this, Pass Selection chooses the single most valuable pass, balancing strategic effectiveness with execution reliability. If a pass got selected, then it is considered in the Action Selection phase, where the attacking robot decides whether to execute the pass or pursue an alternative strategy. A more detailed explanation of the Action Selection process can be found in our TDP from 2018 [4].
The following sections will provide an in-depth look into each step of the pipeline. Precise coordination between our robots is crucial for successful gameplay. To achieve this, we rely on Bang-Bang trajectories [3], while not mathematically optimal, they are computationally efficient and allow us to precisely synchronize timing. Additionally, their low computational cost enables us to sample a large number of scenarios and target positions.
2.1 Pass Generation
In the pass generation phase, we look for pass targets for individual robots that are reachable by the robot within a certain time horizon. To estimate the horizon, we approximate a pass to the current robot. If there is currently a preceding pass in progress, the source of the approximate pass is the location where the shooter will intercept and redirect the ball and additionally, the remaining time of the preceding pass is added. Otherwise, the source is the current ball location and the horizon is equal to the approximate pass duration.
We want the robot to safely receive the ball, so the robot should come to a stop within this time horizon. That's why we use the stopping moving robot from section 1.2 here to generate a circle for the execution time.
In this circle, we randomly generate target positions for potential passes. In an early version of the Pass Generation from 2017 [5], we only took these targets as 2D coordinates, and passed those as pass targets down the pipeline. A major improvement in recent years was to add additional information to this pass. The pass is fully defined from a source to a target and with all the additional information described in section 1.1. This allows for precise time-based analysis of each pass down the pipeline and also allows planning passes that originate from another pass receiver, not only from the current ball location.
For each pass target, we pass both, a straight and a chip pass, down the pipeline. This way, we can compare and rate both variants independently.
2.2 Pass Filtering
The pass filtering process consists of multiple filtering rules, some of which are straightforward, while others require further explanation. The simpler filters ensure that passes adhere to fundamental gameplay constraints, such as staying within the field boundaries and complying with game regulations. These filters include:
- NotInPenArea: Prevents passes from being targeted inside any penalty area.
- KickOffRules: Forbids passes towards the opponent half during our kick off.
- InFieldWithMargin: Maintains a safety margin around the field boundaries to avoid risky passes near the edges.
- KeepMinDistToBall: Ensures a minimum distance between the pass target and the ball to prevent overly short or ineffective passes.
- IsNotNearGoalLine: Avoids passes that are too close to the goal line.
- IsReachable: Verifies whether the receiving robot can reach the pass target via a direct path, without requiring path planning. This ensures that the estimated time to reach the pass target remains accurate.
Beyond these basic constraints, more advanced filters are applied. These include:
- CanBeReceivedOutsidePenArea: Makes sure that the pass can be received at the pass target location without entering the opponents penalty area. We want to be able to plan and play passes very close to the opponents penalty area. This filter makes sure that the robot is physically able to receive the ball without entering the penalty area.
- CanTargetOrientationBeReachedInTime: This filter focuses specifically on situations involving a rolling ball. This filter eliminates passes that the passing robot cannot safely turn to within the available time before the ball arrives. By enforcing this constraint, it ensures that the selected pass remains stable as the ball gets closer, preventing last-moment target switches when there is no longer sufficient time for the robot to adjust its orientation. This improves the reliability of pass reception and overall team coordination. The implementation is straightforward: we calculate the time remaining until the ball reaches the passing robot and estimate the time required for the robot to adjust its orientation toward each pass target. This estimation is based on an accelerated movement model with an initial velocity, combined with the ball model to determine the remaining travel time of the ball. By comparing these values, we can effectively filter out passes that the receiving robot would be unable to align with in time.
- KeepDirectionDuringFreekick: This filter stabilizes the chosen pass target during a free kick. This is important to avoid double touch situations. The filter consists of a maximum angle between the selected pass from the last frame to the current frame. The maximum angle shrinks as the shooter is executing the free kick thus getting closer to the ball. This ensures that the robot can still chose new pass targets as the situations changes but the allowed change in orientation to pass to this newly considered pass targets gets limited more and more.
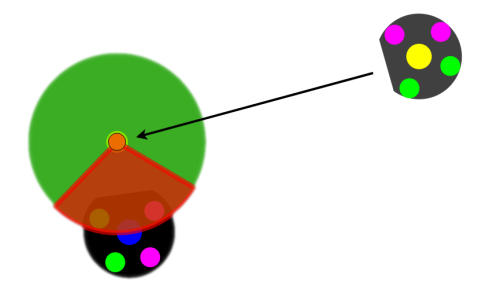
- IsTargetApproachAngleAccesible: This filter ensures that the necessary orientation and position needed to kick the ball to a given pass target is reachable. Meaning, that the position is not blocked by an opponent robot. This avoids movements of our robot into opponent robots. Figure 2 shows the accessible angles (green) and the forbidden angles (red) from the view of the approaching yellow robot. All pass targets that would require our robot to move within the red area will be dismissed.
2.3 Pass Rating
We first introduced our pass rating strategy in our 2019 TDP [6]. The entire rating system has been reworked since. While some of the terminology remains the same, the underlying calculations and algorithms have been completely redesigned. Before 2019, we evaluated pass effectiveness using a single rating score, calculated by multiplying various factors such as interceptability and goal probability into a combined value. Each factor ranged from 0 to 1, with 1 representing the best possible outcome. However, we soon realized that relying on a single composite score made decision-making difficult. After 2019, we introduced a more refined approach by separating the rating into two independent scores: a goal success score and a general pass success score. The idea was to prioritize passes with the highest chance of leading to a goal, but if no such option was available, the system would fall back to selecting the pass with the best overall success rate, even if it did not create an immediate scoring opportunity.
In the last years, we refined this system even further by eliminating the mixing of different ratings altogether. Instead, we now calculate multiple independent scores for each pass, each assessing a specific characteristic. These scores are evaluated separately, allowing for a more flexible and informed decision-making process. The key rating factors we now consider are:
- Passability: Some passes are valid, but not very reasonable. We consider two conditions. First, if the kick speed is too low (like < 1 m/s), we consider it unreasonable, as our robots have difficulties kicking a ball slower than that. Second, we prefer a certain minimum receiving speed for a reasonable pass, like < 2 m/s, which is lower than the desired receiving speed we use during pass generation. Below that, we reduce the score linearly to zero. The idea is to allow slow passes in certain situations, but avoid them if there are better alternatives.
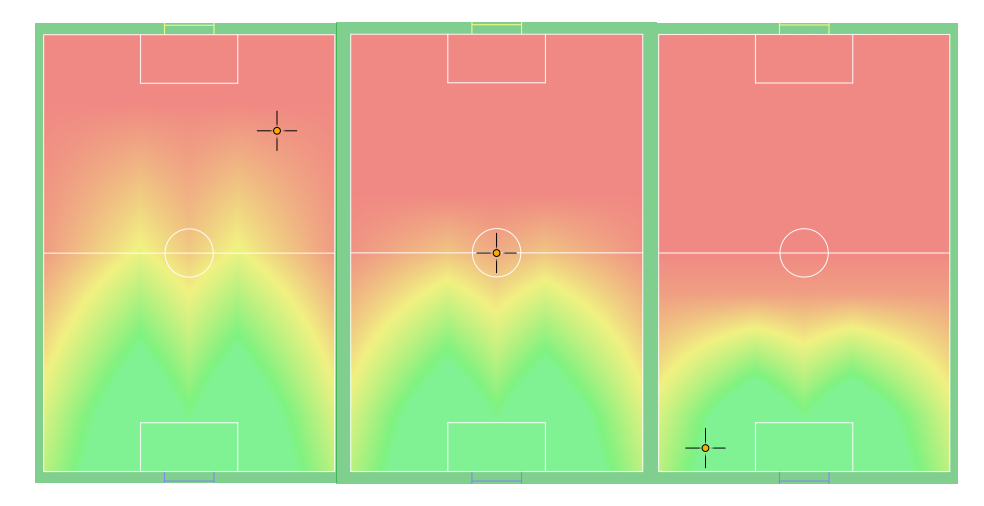
- Pressure: This score is designed to increase pressure on the opponent's goal by advancing the ball into dangerous positions. In general, the score improves as the pass target moves closer to the opponent's goal and decreases for passes played backward towards our own goal. Figure 3 visualizes the score for different positions of the ball. The ball and target positions are the only relevant variables for this score.
- Interception: This scores how well the pass avoids being intercepted by the opponent. This is explained in detail in section 3.1.
- Goal kick: Chance to score a goal from this position after receiving the ball. The rating algorithm relies on the same methods used in the interception rating. After all, a shot on the goal is good, when it cannot be intercepted by opponent robots.
- Redirect goal kick: This score estimates the likelihood of scoring a goal by redirecting the ball into the opponent's goal. It is calculated using the Goal Kick Rater algorithm. We calculate the goal kick score from both the pass origin and the pass target location. First we calculate a base score, the score reflects the improvement in goal probability from the origin to the target, an improvement of 50% is assigned the maximum score of 1, while no improvement results in a score of 0, with linear scaling applied to all intermediate values. Additionally, this base score is adjusted by a factor based on the redirect angle. The factor is 1 for redirect angles below 50° and 0 for angles above 70°, with a linear transition between these two thresholds. This ensures that more favorable redirect angles receive a higher rating, while difficult or unrealistic redirects are penalized accordingly.
2.4 Pass Selection
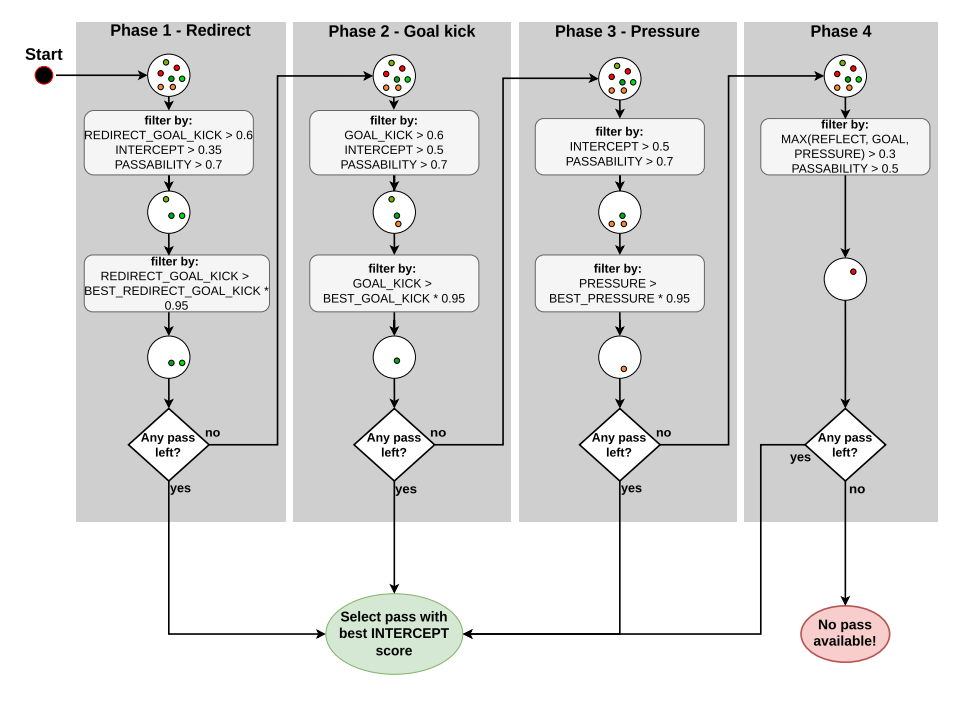
The task of pass selection is to identify the single best pass from all generated candidates. The algorithm is structured into four distinct phases, with execution beginning at phase one. Each subsequent phase is only considered if the previous phase has filtered out all potential passes. As a result, phase one has the highest priority—if any passes remain after this phase, the later phases are skipped entirely. Each phase begins with a list of all available rated passes and applies two filtering stages, except for phase four, which consists of a single filtering stage. If any passes remain after a given phase, then the pass with the highest INTERCEPT score will be selected. Figure 4 illustrates this concept.
- Phase 1 Redirect: The goal of this phase is to identify the best available pass that can be directly redirected into the opponent's goal. The first filtering stage selects passes with a reasonably high redirect score, good passability, and an acceptable interceptability score. Next, the highest REDIRECT_GOAL_KICK score among the remaining passes is determined. In the second filtering stage, only passes with a REDIRECT_GOAL_KICK score close to the highest value are retained, while all others are discarded. This process allows a pass with a slightly lower REDIRECT_GOAL_KICK score than the best available option to be selected if it has a significantly better INTERCEPT score. In most cases, this results in a better overall decision. This phase allows passes with a high risk of interception, as long as the potential reward justifies the risk. Since these passes offer a direct opportunity for a successful redirect toward the opponent's goal, taking a calculated risk can be advantageous.
- Phase 2 Goal kick: The goal of this phase is to identify the best available pass that can be received and then followed by into a direct shot on the opponent's goal. The first filtering stage is similar to that of phase one but with a different focus. This time, the filtering prioritizes passes with a high GOAL_KICK score while also ensuring a good INTERCEPT score, meaning that passes with a lower risk of interception are preferred. The second filtering stage is the same as in phase one, just this time the GOAL_KICK score is used instead of the REDIRECT_GOAL_KICK score.
- Phase 3 Pressure: The goal of this phase is to select passes that have a high chance of success while also increasing pressure on the opponent's goal.
- Phase 4 Last Resort: This is the fallback phase, accepting even sub optimal passes as long as they fulfill at least one of the three key objectives to some extent.
The prioritization of phases and the varying INTERCEPT filtering thresholds ensure continuous pressure on the opponent's goal. Passes with high potential rewards tolerate a greater risk of interception, whereas other passes require a stronger INTERCEPT score. The structure of this algorithm is highly adaptable, as no scores are mixed together, and each phase and filter serves a distinct purpose.
3 Pass Interception
The pass interception rating is the most important and most complex rating of the overall pass rating. It determines how likely a pass is intercepted by an opponent robot. We found that it is important that there is a smooth transition from best to worst score. Due to the fast changing nature of the SSL, passes would otherwise toggle between good and bad often and a stable and reliable pass execution is more difficult.
3.1 Pass Interception Rating
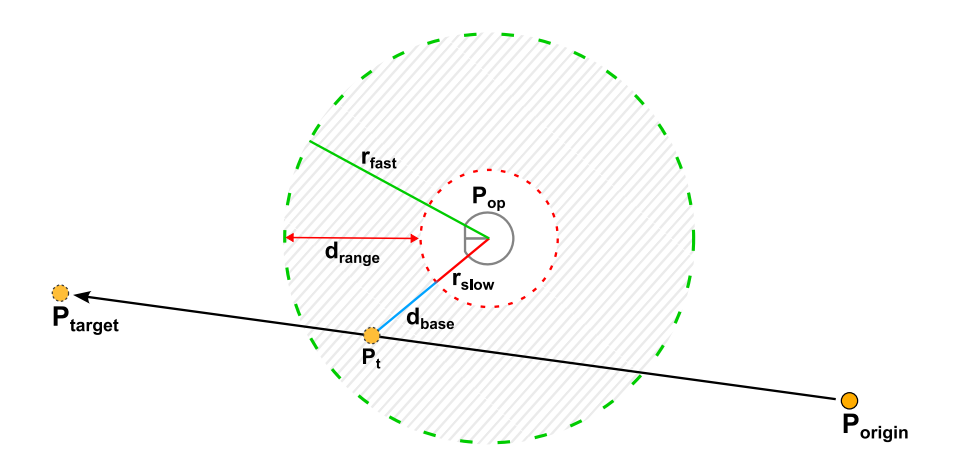
The base implementation makes use of the accelerating and stopping moving robots described in section 1.2. The principle idea is as follows. For every opponent robot, a slow stopping moving robot and a fast accelerating moving robot are considered. The slow one uses low movement limits, the fast one is using the actual estimated movement limits of the opponents. Each moving robot defines a circle depending on time, in which the robot could potentially move. With the fast moving robot, we get an upper limit for the final score, with the slow moving robot, we get a lower limit. A position inside the slow circle is rated with the worst possible score, a position outside the fast circle is rated with the best possible score. Equations (5) to (9) and figure 5 show how the score is calculated between those two circles.
$$P_{center} = \frac{P_{slow} + P_{fast}}{2} \tag{5}$$
$$d_{pos} = |P_{center} - P_t| \tag{6}$$
$$d_{base} = d_{pos} - r_{slow} \tag{7}$$
$$d_{range} = r_{fast} - r_{slow} \tag{8}$$
$$s = \frac{d_{base}}{d_{range}} \tag{9}$$
$t$ is the time at which the check is performed, $P_{slow}$, $P_{fast}$, $r_{slow}$ and $r_{fast}$ are the centers and radiuses of the moving robot circles at time $t$, $P_t$ is the position on the pass travel line at time $t$.
Now, to get an overall score for the pass, we have to find the minimum score on the pass travel line over all robots, by minimizing the score over time using an optimization algorithm. We do not combine the scores between multiple robots, so the score is the same, regardless of how many robots can intercept the pass. Only the most critical one is taken into account.
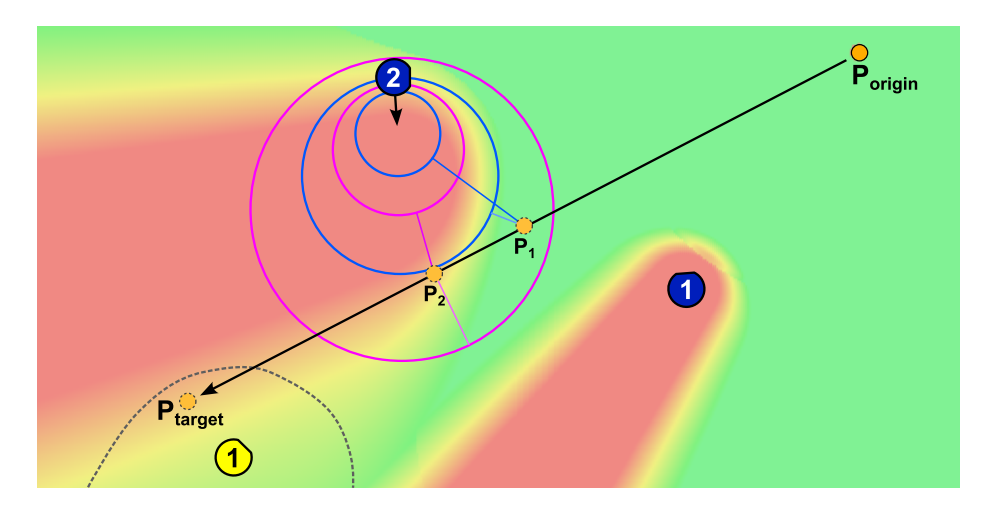
Figure 6 visualizes how the resulting interception score is distribute on the field, without taking the receiving robot into account. An exemplary pass is shown together with the moving robot circles at two different time steps for blue robot 2. At the first time step, the ball (P1) is still clearly outside of both moving robot circles. At the second time step, P2 is about in the middle between the circles, outside the slow moving robot circle, but inside the fast moving robot circle. This results in a score of about 0.5 and it is about the most critical time step, so the overall score is about the same at Ptarget.
In practice, the timing of the receiver is also taken into account. The minimum pass duration is calculated as the time the receiver needs to the pass target plus a fixed preparation time offset. As described in section 2.1, the pass speed is reduced to fulfill the minimum pass duration. A slower pass has significant impact on the score, as opponents have more time to intercept the pass. In figure 6, the range in which yellow robot 1 is able to receive the pass is depicted with a dotted line. The score outside for this specific robot would be zero/red.
The pass interception score heat map only shows the score for a straight pass. The same is done for chipped passes and the overall best score is taken. However, chipped passes get an extra penalty of 0.1 on the final score, as they are less precise and reliable.
3.2 Tracking Pass Success Ratio
An essential part of improving an already well-functioning implementation is understanding the impact of each modification. To achieve this, we implemented a pass tracking system that observes all passes played during a game and records key data for analysis. This data includes the pass origin and target, whether the receiving robot reached the pass line on time, and whether it successfully gained control of the ball.
However, tracking the success of executed passes presents several challenges. Since our robots can update their decisions every frame and select a new pass target dynamically, it is not always clear which planned pass was actually executed. The robot may adjust its kick mode or speed just milliseconds before striking the ball, and due to the inherent delay between reality and our AI, the final decision in the last few frames before execution is often ambiguous.
To address this, we maintain a buffer of recently planned passes. When a kick is detected, we attempt to match the measured ball trajectory with the predicted trajectories from our stored pass plans. This process is particularly difficult for chip kicks, as the initial movement direction of the ball can be highly unstable in the first few frames after the kick. A pass is considered successful only if it reaches the intended receiving robot within the expected time frame and at the planned target location.
3.3 Dynamic Pass Interception Scoring
We implement two methods for dynamically adapting our passing behavior based on opponent tendencies. This adaptation is important because our INTERCEPT score rating relies on various assumptions about how opponent robots react to passes. Some teams may intercept rolling balls aggressively, while others might rarely attempt to block passes. Additionally, different opponent roles influence interception behavior, a dedicated penalty area defender may ignore rolling balls, whereas a midfield attacker is more likely to challenge them.
The first method of adaptation involves tracking our overall pass success ratio, as discussed in the previous section. We use this success ratio to make subtle adjustments to our interception rating method. Our goal is to maintain a target success rate of 70%. If our recorded pass success rate drops below this threshold, we adjust our INTERCEPT score evaluation to be more pessimistic, encouraging safer passes. Conversely, if our pass success rate exceeds 70%, we allow for more aggressive and riskier passes to maximize offensive pressure.
In the previous section, we mentioned that we also track the origin and target of each pass. To analyze this data effectively, we divide the field into different zones and monitor which zones are most commonly connected by passes, along with their respective success rates. This provides us with a rough estimation of opponent behavior based on their positioning on the field, allowing us to infer how different roles influence interception tendencies. The adaptation mechanism remains the same as before, dynamically adjusting the INTERCEPT score by slightly boosting or devaluing it. However, instead of applying a global adjustment based on overall pass success, this method refines the evaluation based on historical success rates of passes between specific zones.
Publication
Our team publishes all their resources, including software, electronics/schematics and mechanical drawings, after each RoboCup. They can be found on our website. The website also contains several publications with reference to the RoboCup, though some are only available in German.
References
- C. Lobmeiner, P. Blank, J. Buehlmeyer, D. Burk, M. Eischer, A. Hauck, M. Hoffmann, S. Kronberger, M. Lieret, and M. Eskofier. ER-Force - Extended Team Description for RoboCup 2016, 2016.
- N. Ommer, A. Ryll, M. Ratzel, and M. Geiger. TIGERs Mannheim - Extended Team Description for RoboCup 2024, 2024.
- O. Purwin and R. D'Andrea. Trajectory generation and control for four wheeled omnidirectional vehicles. Robotics and Autonomous Systems, 54(1):13 – 22, 2006.
- A. Ryll, M. Geiger, C. Carstensen, and N. Ommer. TIGERs Mannheim - Extended Team Description for RoboCup 2018, 2018.
- M. Geiger et al. TIGERs Mannheim - Extended Team Description for RoboCup 2017, 2017.
- N. Ommer, A. Ryll, and M. Geiger. TIGERs Mannheim - Extended Team Description for RoboCup 2019, 2019.