KickOffTUG - Team Description Paper 2009
Stephan Gspandl, Werner Arnus, Julia Gebetsberger, Gerwin Gsenger, Andreas Hechenblaickner, Michael Reip, Christian Wagner, Máté Wolfram, Christoph Zehentner
Institute for Software Technology, Graz University of Technology, Inffeldgasse 16B/II 8010 Graz, Austria
Abstract In the past months KickOffTUG developed its agent code in many directions. On an abstract level we focus on developing methodologies to define and adapt behaviour of agents or robots. We thus propose a system to transform tactics graphs from books on soccer strategies or tablet-pcs and digital whiteboards into behavioural plans as intuitive and easy as sketching on paper.
Furthermore our research comprises new and optimized ways of diagnosing the behaviour and execution of agents or robots. Costs of collaboration, debugging and testing should be minimized by enhancing usability and motivating all members to actively participate. Our Diagnosis Tool makes it even possible to evaluate adaptions offline (i.e. without having to run a game).
Concerning the agents' skills, we have been researching into ways of improving dribbling skills by identifying appropriate features as well as positioning and marking methods. Latter shows empiric results over several algorithms.
1 Automatic Derivation of Behavioural Models
1.1 Introduction
One important task in the RoboCup soccer league is to build up soccer domainknowledge. Most teams of the RoboCup soccer leagues are engaged in adapting soccer knowledge for their robots. Because soccer is a well-covered domain, there exists a broad variety of books and strategic knowledge from soccer experts (like [1] or [2]). Teams use such knowledge to develop their agents' behaviour. This is mostly done by a manual transformation into specific plans or algorithms.
In our view, adapting the agents' behaviour should be as easy and fast as scanning diagrams from expert books or scribbling circles and lines onto a piece of paper or a tablet-pc. We therefore propose a system for an easy translation of soccer strategic graphs to plans defining the agents' roles and abstract behaviours.
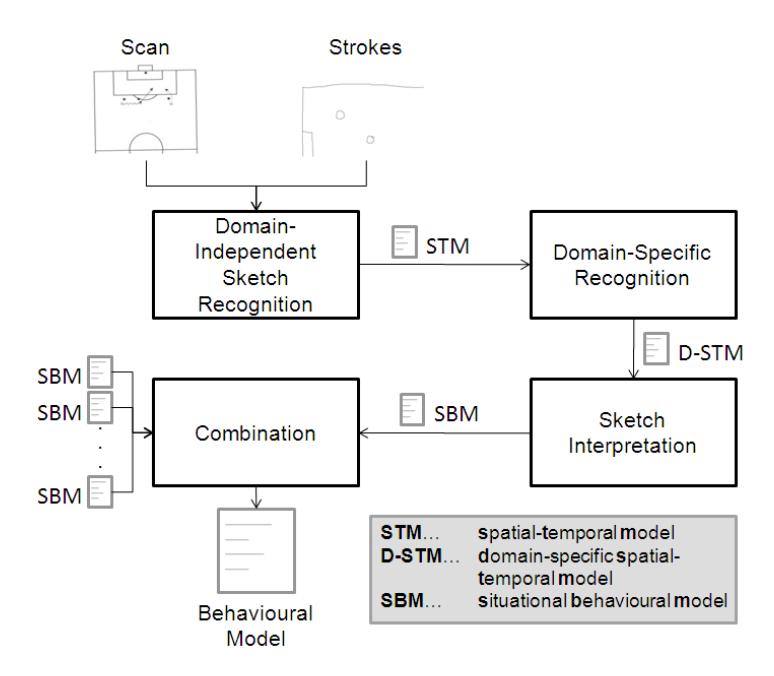
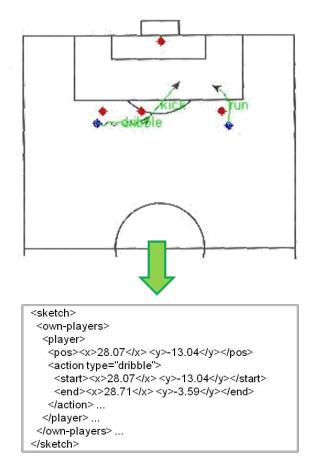
The input to the system is a graph (a scan) or a seqence of strokes (from a tablet-pc or a digital whiteboard) depicting an agent's behaviour in a concrete situation. Our approach is based on several transformations and models of representation. In the first stage we recognize the strategic graph and translate it to a spatial-temporal representation of the described situation. This model typically contains a set of circles representing the own, the opposing players and the ball and a set of different arrows standing for the actions to be performed by the players, respectively. By using a domain-model the spatial-temporal model is then transformed into a domain-specific situation model. This model in turn comprises a set of literals describing the situation given by the strategy graph, the actions which are applied to this situation and a set of conditions describing the situation after application of the actions. A combination of such strategic models creates an overall model of the agents' behaviour.
Fig. 1 sketches this process. As this is work in progress we will discuss only the first approach in this paper.
1.2 First Approach
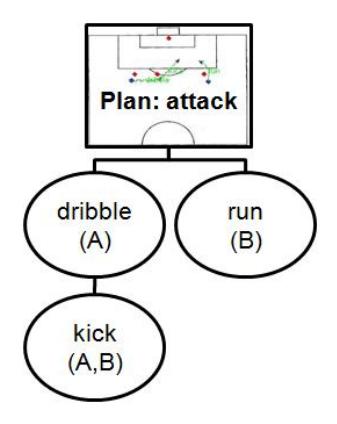
Our first approach is based on the decision-making system in the 2D RoboCup Simulation League team KickOffTUG and a first version of a scan-recognition module built in Matlab. We are using an adaption of T-R-Programs (see [3]) combined with a STRIPS notation (see [4]) to generate plan trees which define the agents' behaviour (see [5], [6] and [7]). At the moment these plans are created by hand using expert knowledge. Simply spoken, a plan tree consists of action nodes, each path in this representation corresponds to a goal in the T-R-notation and the tree is traversed in a depth-like way to find a node whose postconditions (or effects) are false (to denote that the outcome of this action has not yet been fulfilled) and the corresponding preconditions are met (i.e. the action is indeed executable). Invariants help to maintain deliberativity of a decision as an action is executed as long as the invariant remains satisfied. In order for the agent to be reactive, the tree is traversed from the root otherwise (thus, the whole search space is again examined).
![Fig. 2. An example for a tactics graphs from [1].](/tdps/soccer_simulation_2d__2009__KickOffTUG/_page_2_Picture_1.jpeg)
2 Diagnosis Environment
2.1 Introduction
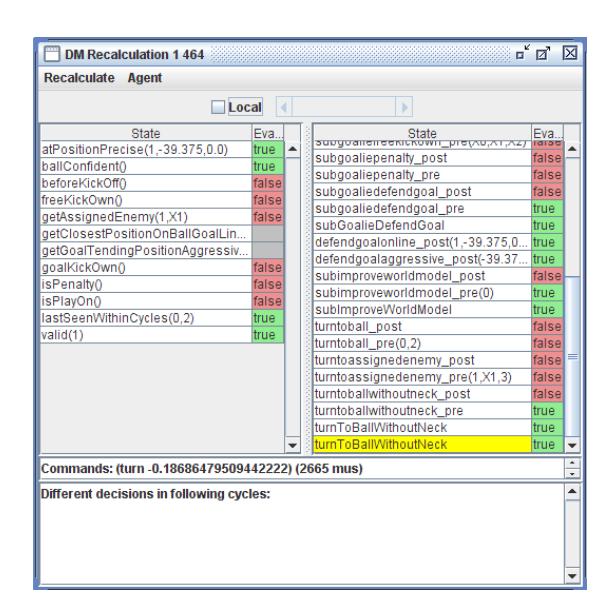
Our GUI for diagnosing the agents' behaviour and execution (Diagnosis Tool) has recently experienced several major improvements, including a new datasource management system and advanced methods for visualizing all kinds of data associated with the agent's decision process. Aim of this project was to improve this tool's usability to motivate all team members to actively participate in our analysis and debugging process.
2.2 Diagnosis Features
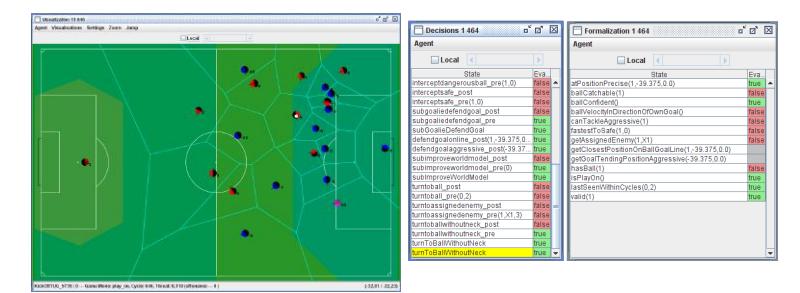
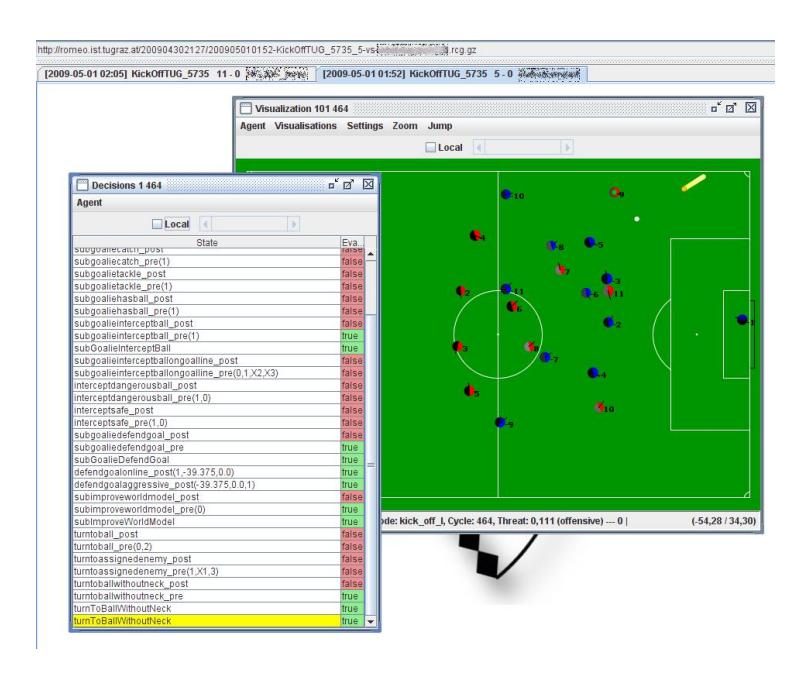
Visualizations The window for visualizing the agents' world states after each game has been enhanced to include all kinds of overlapping visualizations that can be individually written, integrated and activated. Several convenience methods are available to ease this process and to offer the developer a mighty tool for individual debugging, especially if compared to simple system output or logging. Any information presented in the visualization frame is such a visualization, from the world state as we see it through a soccer monitor to Delaunay and Voronoi diagrams or calculations for higher level actions such as passing, dribbling and positioning, to name a few (see Fig. 5).
Another useful and often interesting feature is the mirrored world state that allows us to generate all visualization overlays based on the opposing team. That way, we can compare their actual behaviour to the calculations our agents would have come up with.
2.3 Datasource Management
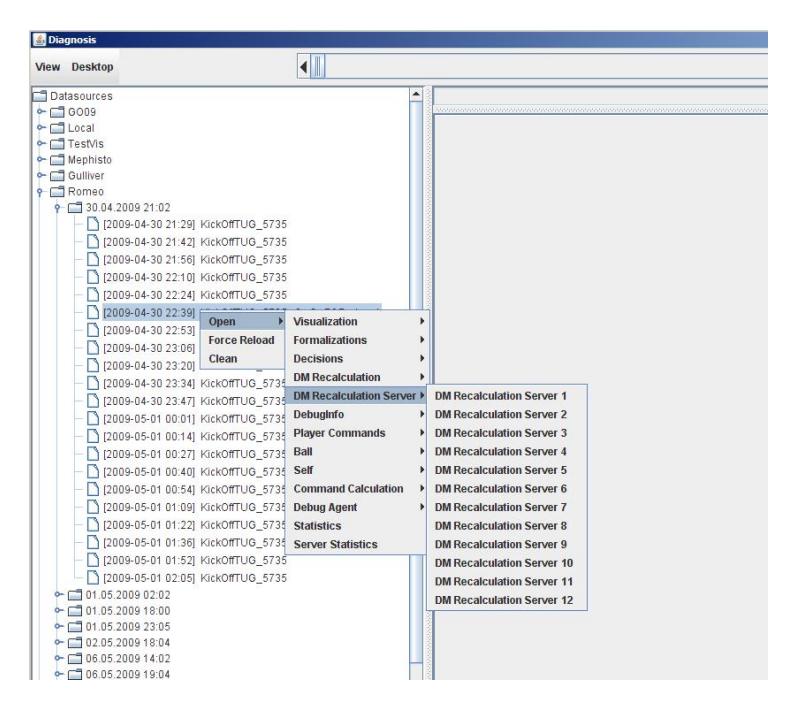
Since our team uses a farm of simulation servers for tournaments to evaluate our agents' skills, all the diagnosis information written during and after simulated matches is stored on these servers and can be accessed online. To enable the developer to quickly overlook and access this huge amount of data, the Diagnosis Tool is able to fetch data from various datasources, including our servers of course, and present it to the developer in a simplified form. Fig. 8 shows how the user can choose among various datasources and open corresponding diagnosis elements.
2.4 Benefits
As mentioned before, the main goal of the Diagnosis Tool is to ease the debugging process and therefore motivate all team members to actively participate in it. However, it's also helpful in terms of team-internal communication of detected issues. Since all team members are working on a central repository of matches and associated logged data, issues can be communicated by simply pointing to a simulated match and a certain cycle, instead of having to send logged data in large files. Also, issues can be easily stored for later reference.
The large amount of available features, especially the visualization frame, offers the developer a way to quickly pinpoint errors or try new code without even having to actually start an agent. Deployment times of new features are dramatically reduced while increasing the quality of the resulting source.
3 Dribbling: Skill of Handling the Ball
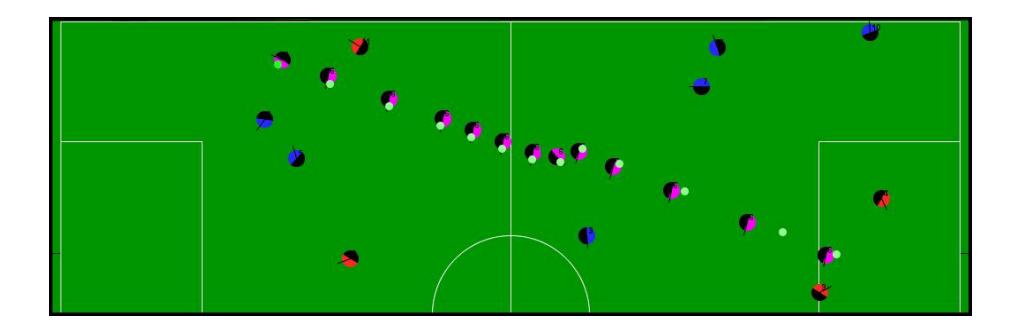
Dribbling is an action, where the player runs with the ball without loosing it. Therefore he should be able to move into various directions and with different kinds of speed. These features have been derived empirically and are subject of discussion in the next paragraphs. Fig. 10 shows an example of applying concrete parameters to the dribbling algorithm.
3.1 Speeds
Three different dribbling speeds are implemented. These are accomplished by calculating the velocity appropriatly.
- Normal: The player kicks the ball with the maximum velocity so that he is able to reach the ball each cycle. Thus, it is possible to change the direction each cycle to avoid opponents.
- Fast: Fast dribbling is used to enable the agent to attack opponents faster. Therefore the ball is kicked in a way that the velocity is equal to the maximal acceleration of the player after some cycles. So the player is not able to reach the ball each cycle which makes the move more risky.
- Slow: When the player uses slow dribbling he has to save stamina or wait until his colleagues are positioned to be able to execute a pass. He accelerates the ball with the half of the velocity of the normal dribbling speed.
3.2 Directions
The dribble directions are given as absolute coordinates on the soccer field. The player should be able to run to a strategic position, but also to avoid opponents. Therefore three different dribbling direction were implemented:
- Position to go: The player should move primarily to this position which could be used to implement different soccer tactics. For instance, if the player is inside the offensive area, he should move, if possible, to the opponent's goal or the corner.
- Dodge direction: The dodge direction is a calculated position where the player should move when opponents are near but not very near. This direction is used to avoid them as early as possible. The direction is calculated with aid of the widest angle between the near opponents.
- Wide dodge direction: This direction is used, when the opponents are very near and the player has to dodge with a larger angle than the normal dodge angle. That angle could be inside the full range of 0◦ to 360◦ .
4 Comparing Several Positioning and Marking Methodologies
4.1 Introduction
Handling the ball while in ball possession or to intercept the ball are important skills in (human or digital) soccer, but most of the time a player takes only part in a passive way without having the ball. During this periods, its main task is to run to a good position an the field depending on the current situation (offensive or defensive play) and to keep the team formation.
Depending on the current ball position and the role of the player, a position on the field can be calculated known as the players home position or strategic position.
While some simple algorithms to calculate these positions are presented in [8] and [9], a more flexible implementation using Delaunay triangulation and linear interpolation was presented in [10].
4.2 Offensive Positioning
To improve position selection during offensive situations the player should find the best position within its reachable area that allows him to receive passes and gives him a good scoring probability.
Based on [11] an algorithm considering the following criteria was implemented:
- Keep formation given by the strategic position.
- Maximize distance to opponents.
- There should be a free way to the opponents goal.
- Direct pass should be possible.
- Keep near offside line.
- Avoid positions near the outlines.
The weights of each criterion depends on the players role (striker, midfielder, defender), the current play mode and the position of the ball.
4.3 Defensive Positioning and Opponent Assignment
To successful defend opponents attacks each attacking player must be marked by one defender. To avoid single opponents to be addressed by more than one player or to leave an attacker unattended, a collaborative assignment of attackers to defenders must be negotiated in the defending team.
To solve this problem, an algorithm presented in [12] that minimizes the costs (a weighted function of the attackers threatness, the distance to the attacker and the distance to the strategic position), of marking all attackers was implemented, giving a good assignment for a man-to-man marking defense strategy.
As in modern soccer zonal marking is very successful, a second algorithm selects the attacker to take care of based on the zones around each players strategic position.
4.4 Experimental Results
All implemented algorithms are compared in a set of matches against other teams released binaries from 2008 RoboCup competitions.
Table 1 shows the strong advantage of the Delaunay triangulation based strategic positioning algorithm against the simple one presented by UvA.
Table 1. Comparision of different positioning implementations.
| Implementation | Goal difference Ball possession | |
|---|---|---|
| UvA [8] Delaunay triangulation [10] |
-5,07 -2,71 |
59,08 % 57,86 % |
| Delaunay with offensive positioning | -2,02 | 59,56 % |
For defensive situations two opponent assignment algorithms explained in the previous section are compared against a simple one that assigns each defender the attacker with the shortest distance and does not avoid double assignments. Best results are achieved by a zonal marking defensive strategy [13].
Table 2. Comparison of different opponent assignment implementations.
| Implementation | Goal difference Ball possession | |
|---|---|---|
| NearestEnemyAssignment | -3,99 | 56,85 % |
| TeamCostEnemyAssignment | -3,25 | 57,82 % |
| ZonalMarkingEnemyAssignment | -2,71 | 57,86 % |
References
- Bangsbo, J., Peitersen, B.: Offensiv Spielen. Verlag Hovedland (2000)
- Lucchesi, M.: Coaching the 3-4-1-2 and 4-2-3-1. Reedswain Publishing (2002)
- Nilsson, N.J.: Teleo-reactive programs for agent control. Journal of Artificial Intelligence Research 1 (1994) 139–158
- Nilsson, N.J., Fikes, R.E.: Strips: A new approach to the application of theorem proving to problem solving. Artifical Intelligence 2(3-4) (1971) 189–208
- Gspandl, S.: KickOffTUG eine KI-Lehr- und Forschungsplattform. Master's thesis, Graz University of Technology, Graz, Austria (October 2007)
- Reip, M.: KickOffTUG Multiagentensystem der RoboCup Simulation League. Master's thesis, Graz University of Technology, Graz, Austria (October 2007)
- Gspandl, S., Monichi, D., Reip, M., Steinbauer, G., Wolfram, M., Zehentner, C.: Kickofftug - team description paper 2007. In: Proceedings of RoboCup 2007: Robot Soccer World Cup XI. (2007) beiliegend.
- de Boer, R., Kok, J.: The incremental development of a synthetic multi-agent system: The uva trilearn 2001 robotic soccer simulation team. Masterarbeit, University of Amsterdam (2002)
- Reis, L.P., Lau, N., Oliveira, E.C.: Situation based strategic positioning for coordinating a team of homogeneous agents. In: Springer's Lecture Notes in Artificial Intelligence, Vol. 2103, Springer-Verlag (2001) 175–197
- Akiyama, H.: HELIOS2007 Team Description (2007)
- Razykov, S., Kyrylov, V.: While the ball in the digital soccer is rolling, where the non-player characters should go if the team is attacking? In: Future Play '06: Proceedings of the 2006 conference on Future Play. (2006)
- Kyrylov, V., Hou, E.: While the ball in the digital soccer is rolling, where the non-player characters should go in a defensive situation? In: Future Play '07: Proceedings of the 2007 conference on Future Play, ACM (2007) 90–96
- Gspandl, S., Monichi, D., Reip, M., Schubert, M., Wolfram, M., Zehentner, C.: Developing a general framework for artificial intelligence. Third Austrian RoboCup Workshop (2008)