HELIOS2012 Team Description Paper
Hidehisa Akiyama, Hiroki Shimora, Tomoharu Nakashima, Yosuke Narimoto, Katsuhiro Yamashita
Faculty of Engineerings, Fukuoka University, Japan; Graduate School of Engineering, Osaka Prefecture University, Japan
http://sourceforge.jp/projects/rctools/
Abstract HELIOS2012 is a 2D soccer simulation team which has been participating in the RoboCup competition since 2000. This paper describes the overview and the current effort of HELIOS2012. We recently focus on an online tactics planning in a continuous state-action space. We applied a tree search method to the RoboCup soccer 2D simulation environment and analyzed its effectiveness by evaluating the team performance.
1 Introduction
HELIOS2012 is a simulated soccer team for the RoboCup soccer 2D simulator. The team has been participating in the RoboCup competition since 2000, reached the 1st place in 2010 and the 2nd place in 2011. We recently focus on an online tactics planning in a continuous state-action space. In this paper, we briefly introduce our released software and describe our tactics planning method.
2 Released Software
We have released several open source software to develop a simulated soccer team. Now, we are mainly maintaining following software packages:
- librcsc: a base library for a simulated soccer team.
- agent2d: a sample team program using librcsc. Newbies can use agent2d as a start point for developing their own team.
- soccerwindow2: a high functional viewer, which can be used as a monitor client, a log player and a visual debugger.
- fedit2: a formation editor for agent2d. fedit2 enables us to design a team formation using human's intuitive operations.
They are implemented from scratch without any source code of other simulated soccer teams. But, several idea were inspired from other released code, such as CMUnited[1], FC Portugal[2], YowAI[3], TsinguAeolus[4], UvA Trilearn[5, 6] and Brainstormers[7, 8]. Thanks for their contributions.
Available at: http://sourceforge.jp/projects/rctools/
3 Online Tactics Planning
We propose a framework to search for the optimal action sequence in a continuous state-action space using a game tree search methodology. In this paper, we defined tactics is an action sequence performed by multiple agents within a pre-specified period of time steps. The proposed framework enables agents to plan the tactics of the team online.
3.1 Framework to Search Action Sequence
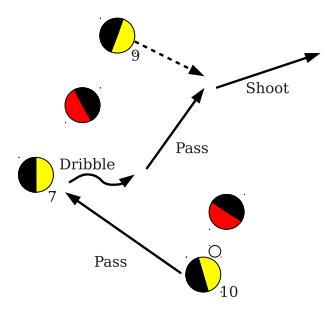
The proposed framework generates and evaluates a number of action sequences performed by multiple agents in a continuous state-action space. Generated actions are stored as a node of search tree. A path from the root node to a leaf node represents an action sequence that defines tactics. Fig. 1 shows an example of action sequence.
The proposed framework generates action sequences and evaluate their values using the following modules:
- ActionGenerator: This module generates action instances that are candidates for a node in the serarch tree. The action instance and the predicted state after the action are combined to form an ActionStatePair instance. The ActionStatePair instance is added as a new node in the search tree.
- FieldEvaluator: This module evaluates the value of the generated Action-StatePair instances.
In the current implementation, we employed the best-first search algorithm as a tree search algorithm. Each node has a value calculated by the FieldEvaluator based on the corresponding ActionStatePair instance.
3.2 Experiment
In order to analyze the performance of our search framework, we performed simulation experiments with several settings. We used the following parameters:
- Maximum tree depth : {1(no tree search), 2, 3, 4, 5}
- Maximum number of traversed node : {10, 100, 1000, 10000, 100000}
- ActionGenerator : {Normal, Reduced}
- FieldEvaluator : {Complex, Simple}
The Normal type ActionGenerator is same as the one used by HELIOS2011. The number of actions that the Reduced type ActionGenerator can generate is about one half of the Normal type.
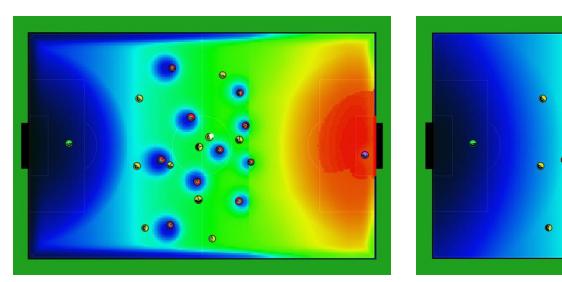
The Complex type FieldEvaluator is same as the one used by HELIOS2011, that uses the hand coded rules with various state variables and the rules are manually tuned. The Simple type FieldEvaluator also uses the hand coded rules, but much simpler than the Complex type. Fig. 2 shows example value mapping on the 2D simulation soccer field.
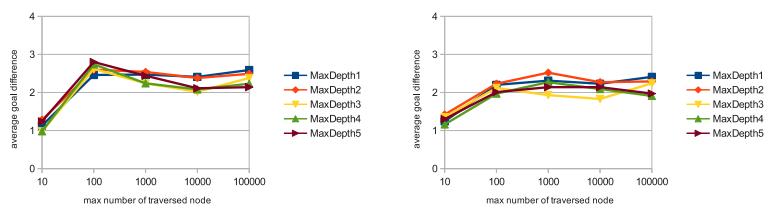
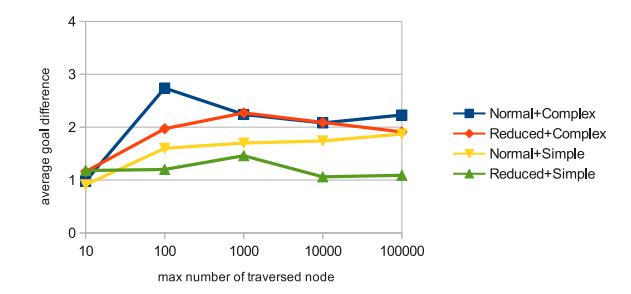
We used an average goal difference as a team performance indicator. Fig. 3 shows the results of each setting. All values are the average of 100 games. In all cases, we can find the team performance become worse when the maximum number of traversed node is 10. This is because agents easily fell into the local minimum. On the other hand, it seems the team performance became stable if the maximum number of traversed node is more than or equals to 100. This results mean that the valuable action sequences can be found within nearly 100 node traverses.
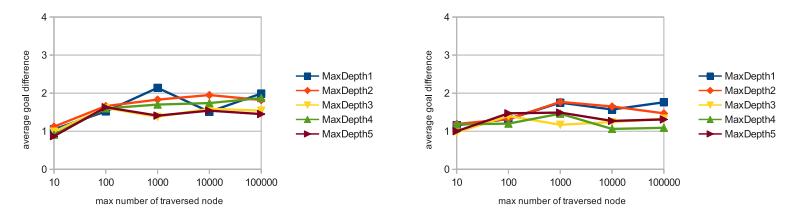
Fig. 4 shows the results for each pair of ActionGenerator and FieldEvaluator. The results show that various state variables and rules should be considered in the FieldEvaluator. And, we can find that the number of action patterns generated by ActionGenerator will also affect the team performance.
We could not find the concrete reason why the maximum tree depth has no correlation to the team performance. We guess that the oscillation of tactics caused by the poor accuracy of predicted state produced these results.
4 Decreasing Oscillations in Tactics Planning
In this paper, the oscillation of decision making is defined as follows. When the ball owner agent holds the ball more than 1 cycle,
- the action type is changed,
- the target player is changed, or
- the error of target position is over the pre-specified threshold.
It is important to decrease the oscillations of decision making in order to stabilize the agent's behaviour. In this section, we propose a modified evaluation function model to decrease the oscillations of decision making.
4.1 Modified Evaluation Function Model
We propose a modified evaluation function model that can adjust the values evaluated by FieldEvaluator. The evaluation value $e$ is modified by the following equation:
$$e' = e \times exp(-k \frac{||p_{t_n} - p_{t_m}||}{(1 + (t_n - t_m))})$$
where $e'$ is the modified evaluation value, $t_n$ and $t_m$ are the current time and the time at the previous decision making respectively, $p_{t_n}$ and $p_{t_m}$ are the current target position and the target position at the the same tree depth of the previous decision making, and $k$ is a non-negative real value parameter to change the effect of the time and the distance.
4.2 Experiment
Table 1 shows that the proposed model can decrease the oscillations of decision making. And, it seems the suitable value of parameter $k$ is between 1.0 and 5.0.
The number of oscillations and their ratio. The results are the average values of 20 games against agent2d.
| k | # of decision making | # of oscillations | ratio |
|---|---|---|---|
| 0(No effect) | 1926 | 1389 | 0.7212 |
| 0.1 | 2677 | 791 | 0.2955 |
| 0.5 | 3130 | 709 | 0.2265 |
| 1 | 3634 | 594 | 0.1635 |
| 1.5 | 3661 | 741 | 0.2024 |
| 3 | 4047 | 619 | 0.1530 |
| 5 | 4085 | 643 | 0.1574 |
| 10 | 4414 | 966 | 0.2188 |
| 50 | 5264 | 1012 | 0.1922 |
| 100 | 4676 | 963 | 0.2059 |
Table 2 shows the performance evaluation against the opponent teams that participated in the RoboCup2011. We performed 20 games for each team and analyzed the average ball possession ratio as a peformance indicator. The result shows the performance becomes better for some teams. However, the average goal difference has not been always improved. It is necessary to analyze the games in more detail to evaluate the team performance.
Ball possession rate for each oppoentn team.
| Team | Without model | With model |
|---|---|---|
| agent2d | 0.6578 | 0.6965 |
| AUA | 0.4813 | 0.4996 |
| Edin | 0.6429 | 0.6840 |
| Hfut | 0.5909 | 0.6014 |
| Photon | 0.5454 | 0.6037 |
| RMAS | 0.7720 | 0.7761 |
| Wright | 0.4381 | 0.4272 |
5 Conclusion
This paper described the research focus and the current effort of HELIOS2012. We applied a game tree search methodology for online tactics planning. Some experiments were performed to show the effectiveness of our approach. Now, we are trying to improve the evaluation function for our framework using machine lerning techniques.
References
- Stone, P., Riley, P., Veloso, M.: The CMUnited-99 champion simulator team. In Veloso, M., Pagello, E., Kitano, H., eds.: RoboCup-99: Robot Soccer World Cup III. Volume 1856 of Lecture Notes in Artificial Intelligence. Springer Verlag, Berlin (2000) 35–48
- Reis, L.P., Lau, N., Oliv´eira, E.: Situation based strategic positioning for coordinating a simulated robosoccer team. Balancing Reactivity and Social Deliberation in MAS (2001) 175–197
- Nakayama, K., Ako, T., Suzuki, T., Takeuchi, I.: Team YowAI-2002. RoboCup 2002: Robot Soccer World Cup VI (2002)
- Yao, J., Chen, J., Cai, Y., Li, S.: Architecture of tsinghuaeolus. In: RoboCup 2001: Robot Soccer World Cup V, Springer-Verlag (2002) 491–494
- Kok, J.R., Vlassis, N., Groen, F.: UvA Trilearn 2003 team description. In Polani, D., Browning, B., Bonarini, A., Yoshida, K., eds.: Proceedings CD RoboCup 2003, Padua, Italy, Springer-Verlag (July 2003)
- UvA Trilearn 2003. http://www.science.uva.nl/˜jellekok/robocup/2003/
- Riedmiller, M., Gabel, T., Knabe, J., , Strasdat, H.: Brainstormers 2d team description 2005. In Bredenfeld, A., Jacoff, A., Noda, I., Takahashi, Y., eds.: Proceedings CD RoboCup 2005, Springer-Verlag (2005)
- Brainstormers 2d: Brainstormers Public Source Code Release. http://sourceforge.net/projects/bsrelease/