ARAS Team Description Paper 2021
Maryam Teimouri, Armin Sadreddin, Mojtaba Moazen, Alireza Sadraii Rad
K.N. Toosi University of Technology, Tehran, Iran
Abstract This paper is going to represent the output and implemented methods of ARAS 2D Soccer Simulation Team. These approaches are categorized in offense strategies and defense strategies. For each part we have applied different algorithms due to the problem and the chosen solution. These algorithms are varied in machine learning, matching and plate division algorithms.
Keywords: machine learning, matching algorithms, plate division algorithms.
1 Introduction
ARAS Robotics Team has now three subgroups including Soccer Simulation group. This part, launched at march 2017 (under another name), has participated in all the national and international competitions held in Iran since 2017 [1]. We have been qualified for 7 competitions and won two best presentation awards in IranOpen 2017 and AsiaSpacific 2018, took the third place at ShirazOpen 2018 and the second place at NasirCup 2019.
In this paper we are going to explain our efforts that have a satisfiable result gained in our three years research. These all are implemented on agent2d-3.1.1 [2].
2 Related Works
Here we are going to investigate articles published by 2D teams. Helios2019 team worked on soccer game analysis and proposed a method that adopts an approach of natural language processing and clustering in order to measure the similarity between teams [3]. FRA-UNIted team implemented machine learning algorithms to increase communication and goal keeper performance [4]. Cyrus2D team has researched on optimizing defense decisioning using Qlearning algorithms, offense decisioning optimization by considering opponent's players' affect and improving defensive behavior using communication [5][6][7]. Razi team has a research on agent's action skills and chain action's state evaluation for agent's offensive behavior. They also added marking act to agent's defensive behavior [8]. Namira team has developed a match-holding and match-analyzing software (TPAS) and also implemented a formation detection system [9].
These papers helped us to develop our ideas to modify the source code and evaluating the changes by running games against related binaries.
3 Defense Strategy
At first, we are going to define our main idea of the agent behavior in defense mode.
3.1 Decision making for marking opponents using Hungarian matching algorithm and Voronoi Diagrams
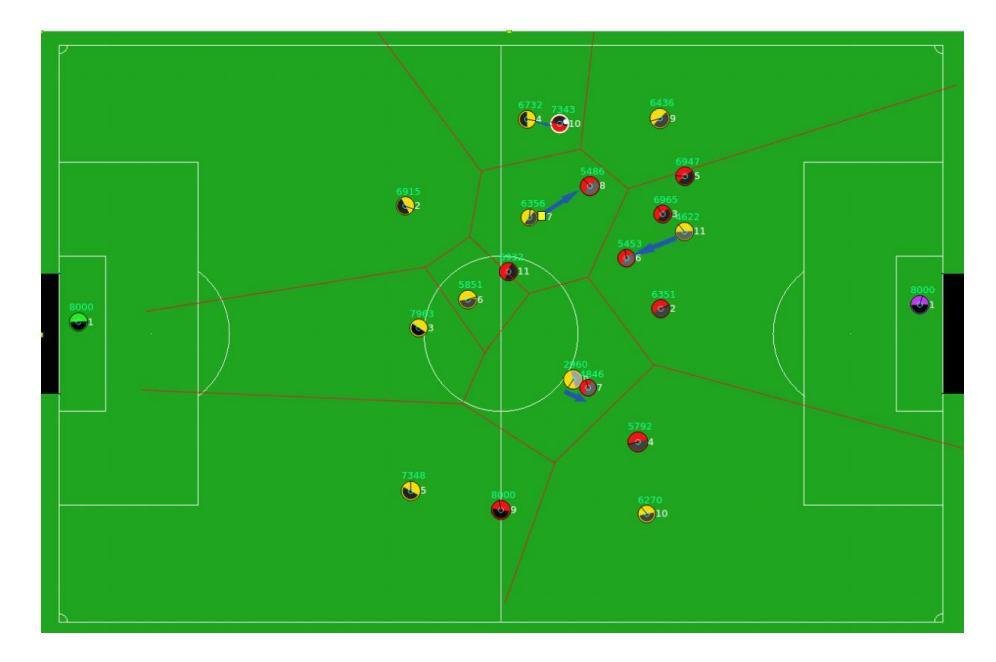
To increase the chance of making a goal we decided to rise the team ball possession. Making this happen, we tried marking opponent's attackers while saving a basic position (we call it formation hereafter). So, after searching about marking algorithms, we implemented what is called zonal marking in soccer: Every player has a zone to mark within it and this zone is determined by their formation. We give formation's nodes as input to our Voronoi Diagrams and every agent marks the most important opponent in his zone [10]. Although this algorithm seemed to be an improvement upon base's simple defense, soon it proved to be inefficient due to the fact that there are lots of situations where there is more than one opponent in a zone and by using mentioned method, we will never mark them all (see Fig. 1). To overcome this trouble, we used Hungarian matching algorithm [11].
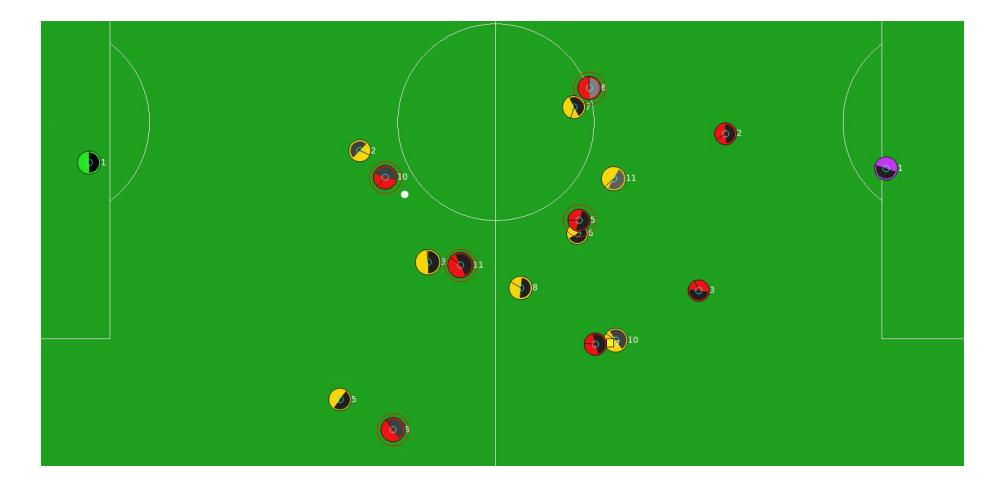
In this method we aimed to solve previous algorithm's problem while minimizing the whole team displacement which has an adverse effect on our agents' stamina. First, we defined three sets of values; mate val which is a value given to a teammate based on its effectiveness as a defender, opp val which is given to an agent due to how dangerous it is as an opponent, and an isValid Boolean variable that's assigned by Voronoi Diagrams. There are a number of factors affecting each of these values (e.g. defender's distance from opponent for former, opponent's distance from our goal for latter and many other factors). Next, we used Hungarian matching to find the best set of pairs that contains an opponent and his corresponding marker. This way we could accomplish our 3 main concerns: Keeping the team's formation while saving our stamina and marking opponents (see Fig. 2).
In order to evaluate this idea, we compared the efficiency of the new code on agent2d against agent2d itself. We got 36 percent progress in 300 games.
4 Offense Strategy
In this section, there is going to be two policies; first policy belongs to the nonkickable players and the second policy manages our kickable player's behavior.
4.1 Offensive positioning by simulating passes for different positions
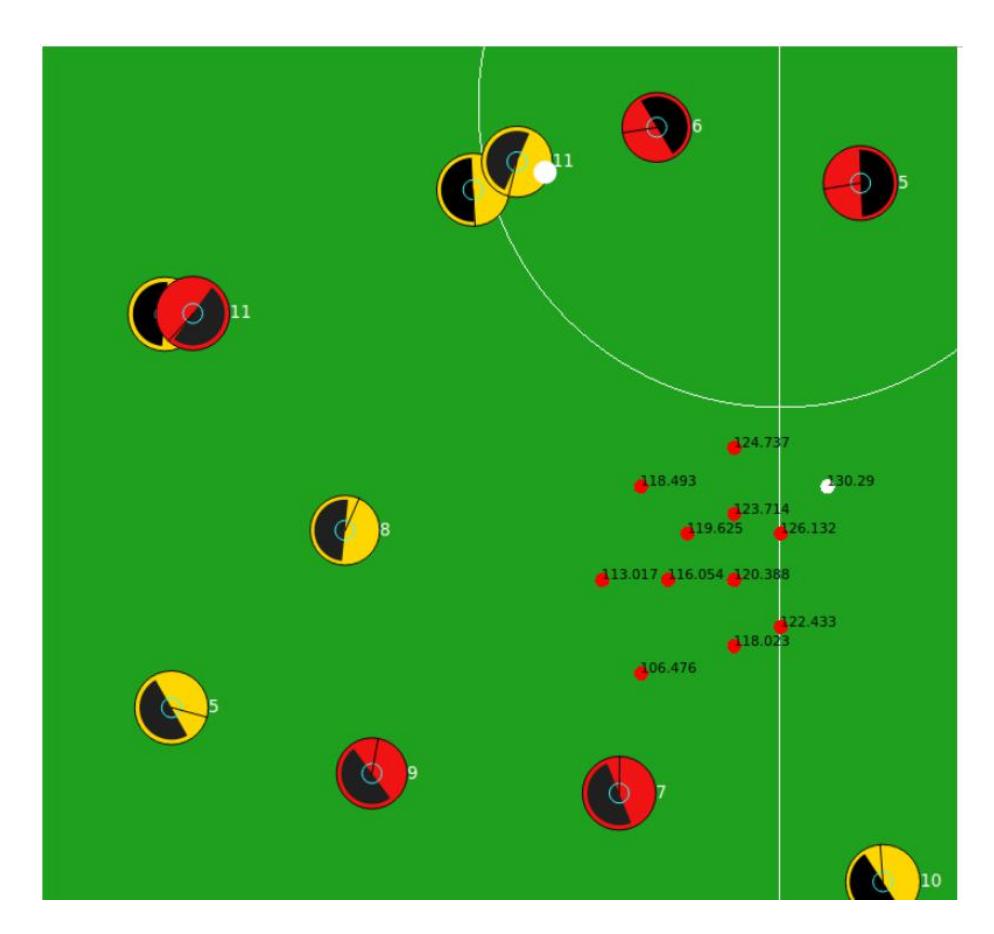
In offensive situations non-kickable players need to be in a suitable place to receive a productive pass and they should be able to get to that point on time. About the second important consideration, sometimes it is not demanded that an agent be in a special position to get a pass directly from the teammate which holds the ball. It can receive the ball through a second pass from another teammate. At first, we determine the chain that conducts the ball to each player of us. Next, we have to find the best place in order to receive the pass. To do this we simulated each pass our player could receive around its formation and tried to find out whether opponent would intercept each of these passes. Then we picked up the best point from the possible choices. We did the same for our second receiver considering our first receiver is now the ball holder (see Fig. 3). As you can see in Fig3 some nodes are generated as scape targets. The values are written above them and the while one is chosen.
This process can be done as many times as possible but the more the layers number are, the less reliable the results become and the more calculations turn out to be. So, we decided to fix layers' number on three (3 passes).
4.2 Offensive decision using Markov Decision Process (MDP)
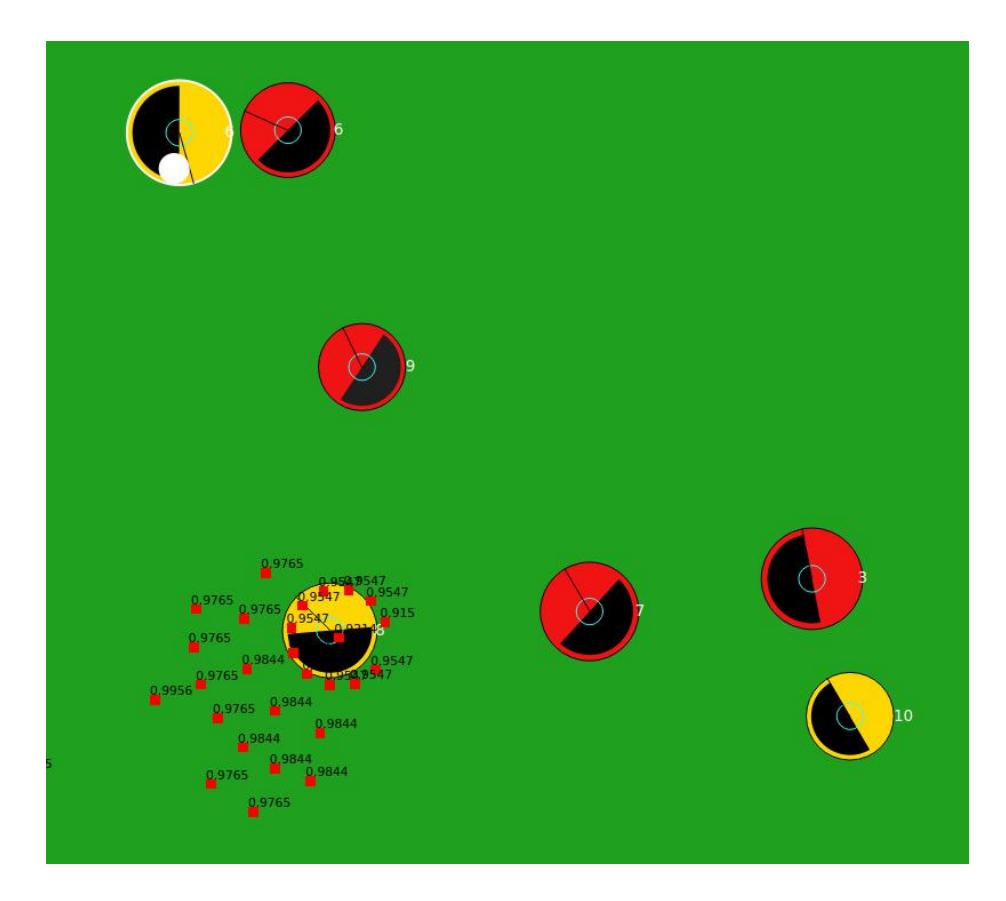
2D Soccer Simulation environment is stochastic, therefor for each possible act there are different possible results. The probability of these possible states depends on the environment's noise. This probability has been calculated by using the coach in 300 games (only the direction noise). For choosing the best action we simulate what will happen if the noise takes place. So, the final value for each act (pass, dribble, or shoot) calculated to apply this method. It helps to take action more rational and less risky at the same time (see Fig. 4). As you can see in Fig4, agent 6 possible passes are drawn with their success probability above them.
The difference in the performance between the team with MDP and the agent2d is about 20 percent in 300 games.
Table 1. In this table columns are angles in degree and rows show the ball speed. The cells' values are acts' error in percentage.
| duration 0-2 | 2-3 | 3-4 | 4-5 | 5-6 | 6-7 | 7-8 | 8-9 | 9-10 more | |
|---|---|---|---|---|---|---|---|---|---|
| 0.9-1.2 | 53.17 16.10 10.24 11.22 4.39 1.95 2.44 0.00 | 0.00 0.00 | |||||||
| 1.2-1.5 | 51.34 19.20 10.71 11.61 2.68 3.12 0.45 0.45 | 0.00 0.45 | |||||||
| 1.5-1.8 | 52.35 21.76 8.82 | 7.65 | 1.18 1.18 3.5 | 31.18 0.00 2.35 | |||||
| 1.8-2.1 | 51.34 20.76 11.61 8.93 | 2.23 1.79 1.34 0.22 | 0.22 1.56 | ||||||
| 2.1-2.4 | 51.47 16.53 12.53 6.93 | 4.00 1.07 0.80 1.07 | 1.07 4.53 |
5 Conclusion
This team description paper described the approaches and algorithms implemented in the code them. A series of computational experiments were conducted in order to show the effectiveness of the strategies that you can see the summary in the table below.
Table 2. You can see the tasks' final result is the table above.
| Task | Win Rate | Goal For | Goal Against | Game Count |
|---|---|---|---|---|
| Defense | 85% | 2.72 | 0.96 | 300 |
| Unmark | 86% | 4.22 | 2.18 | 300 |
| MDP | 70% | 2.67 | 1.81 | 300 |
References
- Maryam Teimouri, Armin Sadreddin, and Alireza Sadraii Rad. ARAS Robotics Team, 2021, kn2c.aras.kntu.ac.ir/rcss2d. Accesed May 1, 2021.
- Hidehisa Akiyama, Tomoharu Nakashima, HELIOS Base: An Open Source Package for the Robocup Soccer 2D Simulation", RoboCup 2013: Robot World Cup XVII., pp. 528535, 2014.
- Akiyama, H., Nakashima, T., Fukushima, T., Suzuki, Y., Ohori, A.: Helios 2019: team description paper. In: RoboCup 2019 Symposium and Competitions, Sydney, Australia (2019)
- T. Gabel, P. Kloppner and F. Sommer, "FRA-UNIted Team Description 2019," in RoboCup 2019, Sydney, Australia, 2019.
- Zare N, Sarvmaili M, Mehrabian O, Nikanjam A, Hossein S, Khasteh AS, Amini O, Barahimi B, Majidi A, Mostajeran A. Cyrus 2D Simulation 2019.
- Khayami R, Zare N, Karimi M, Mahor P, Afshar A, Najafi MS, Asadi M, Tekrar F, Asali E, Keshavarzi A. CYRUS 2D simulation team description paper 2014. InRoboCup 2014 Symposium and Competitions: Team description papers 2014.
- Keshavarzi A, Zare N. Coordination Approach to Find Best Defense Decision with Multiple Possibilities among Robocup Soccer Simulation Team. Journal of Computer & Robotics. 2013 Feb 1;6(2):1-6.
- M. Noohpisheh, M. Shekarriz, A. Bordbar, M. Liaghat and A. Salimi, "Razi Soccer 2D Simulation Team Description Paper 2019," in RobCup 2019, Sydney, Australia, 2019.
- Asali E, Negahbani F, Tafazzol S, Maghareh MS, Bahmeie S, Barazandeh S, Mirian S, Moshkelgosha M. Namira Soccer 2D Simulation Team Description Paper 2018.
- Klein, Rolf (1989). "Abstract voronoi diagrams and their applications". Computational Geometry and its Applications. Lecture Notes in Computer Science. 333. Springer-Verlag. pp. 148–157.doi:10.1007/3-540-50335-8 31. ISBN 978-3-540-52055- 9.
- Harold W. Kuhn, "The Hungarian Method for the assignment problem", Naval Research Logistics Quarterly, 2: 83–97, 1955. Kuhn's original publication.
- Anthony Rocco Cassandra: Exact and approximate algorithms for partially observable markov decision processes: Pub, of Doctoral Dissertation Brown University Providence (1998).